
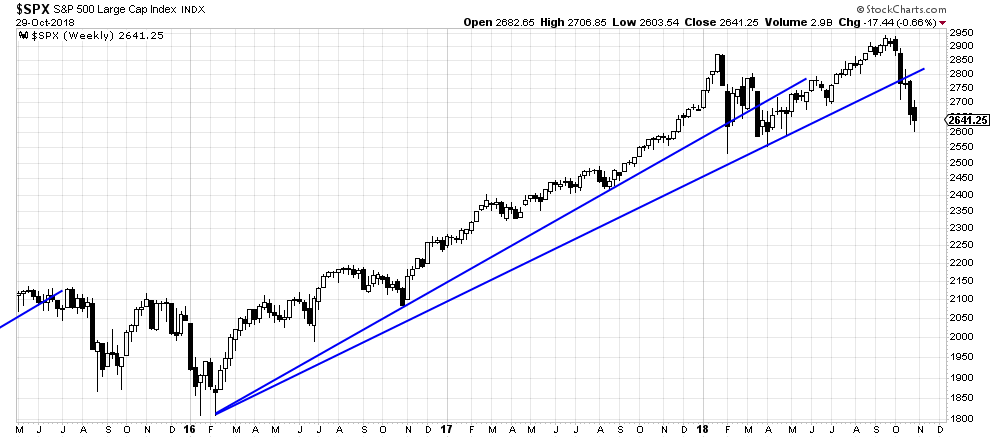
 This chart clearly shows the break of the 2016 trend line. Below we will examine the placement of long term Basing Point stops.
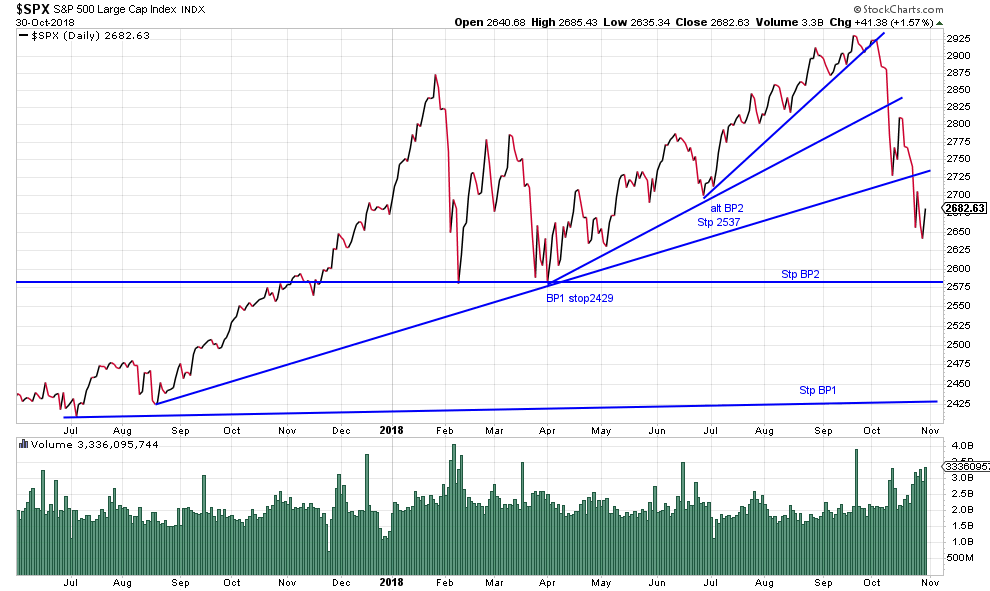
It is always wise to know where the long term stops (calculated from Basing Points) are located. In this chart, the horizontal lines represent stop locations depending on the Basing Point you choose. In our opinion the lower line (2429) is the signal that the bull market has broken. Nevertheless the upper line (2537) is a valid stop level also. So if the risk between the present price and the 2429 stop is uncomfortable you can use the upper stop.
Volatility risk remains sky high. Long positions are extremely subject to turbulence. Well--so are shorts.
W.H.C. Bassetti
Edwards-Magee.com
Click here for more information on subscribing to the Edwards & Magee newsletter.