“When a stock doesn’t do what you expect it to do, sell it." -Justin Mamis
I routinely track the Relative Rotation Graph for the broad S&P sectors to identify timely movements. Today I noticed the Consumer Staples sector rotating from the “weakening” to the “lagging” quadrant:
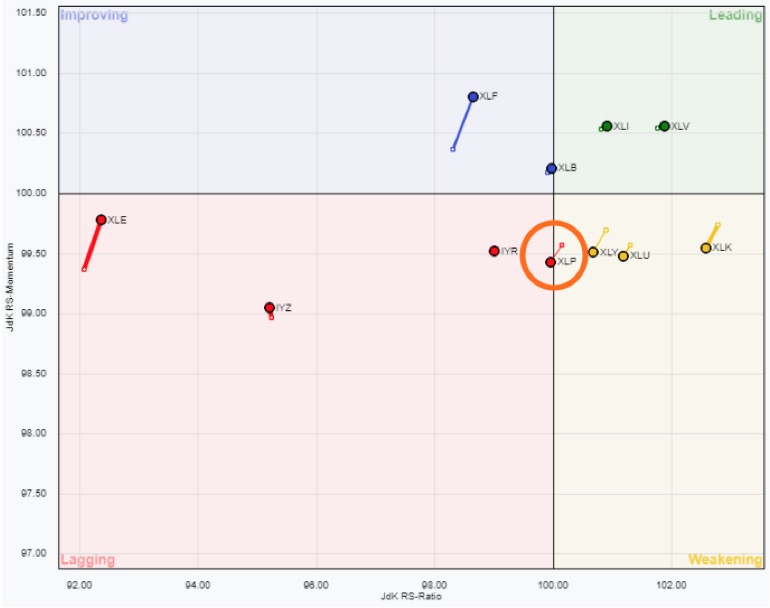
This led me to review some of the charts in the sector, many of which quite simply look like bad charts. I like to group charts by similar patterns, a process I call “bucketing” stocks. This helps me to see what is working, what isn’t, and most importantly what names are at timely entry and exit points.
Here are some of the simple buckets I created, along with some sample charts with notations on the charts. You’ll notice I’m using fairly long-term weekly charts, but regardless of your time horizon, you always want to be aware of the long-term trend!
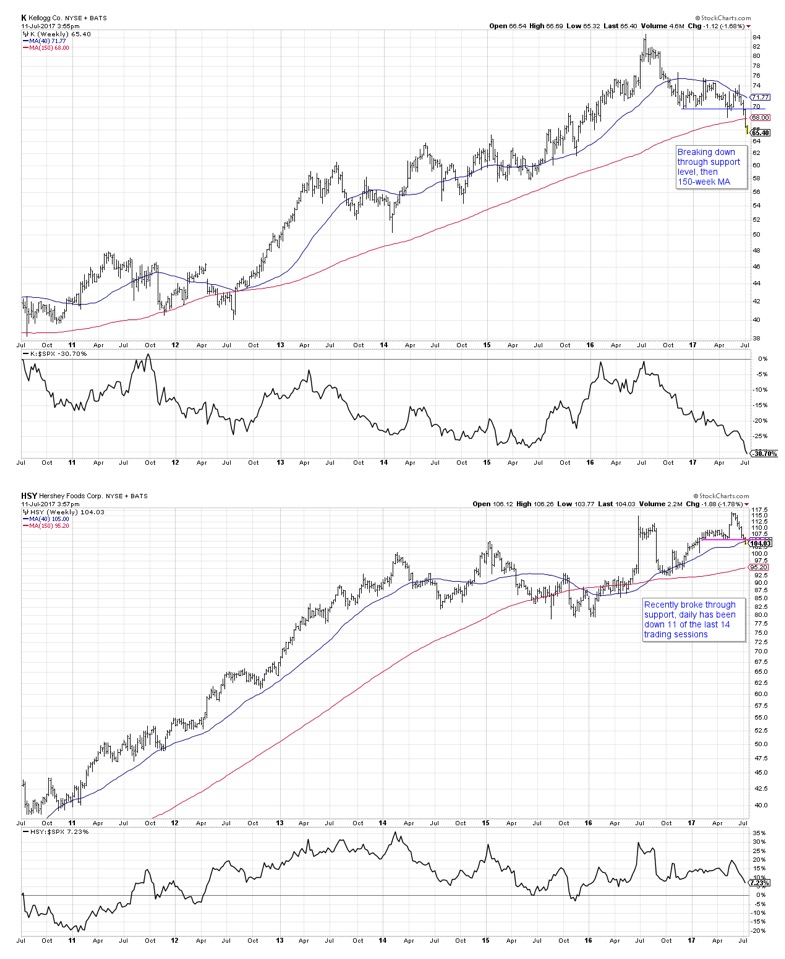
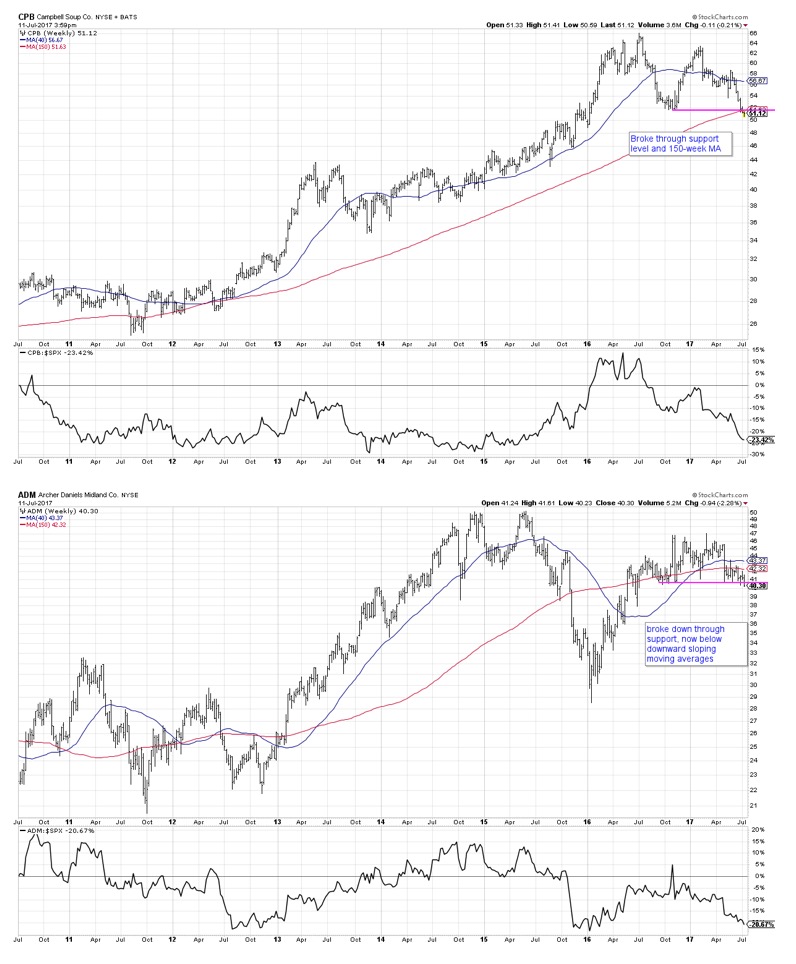
Bucket #1: breaking down through key levels
These are charts that are breaking down, some of them just breaking down this week. Many of the names I noticed were in the food products group.
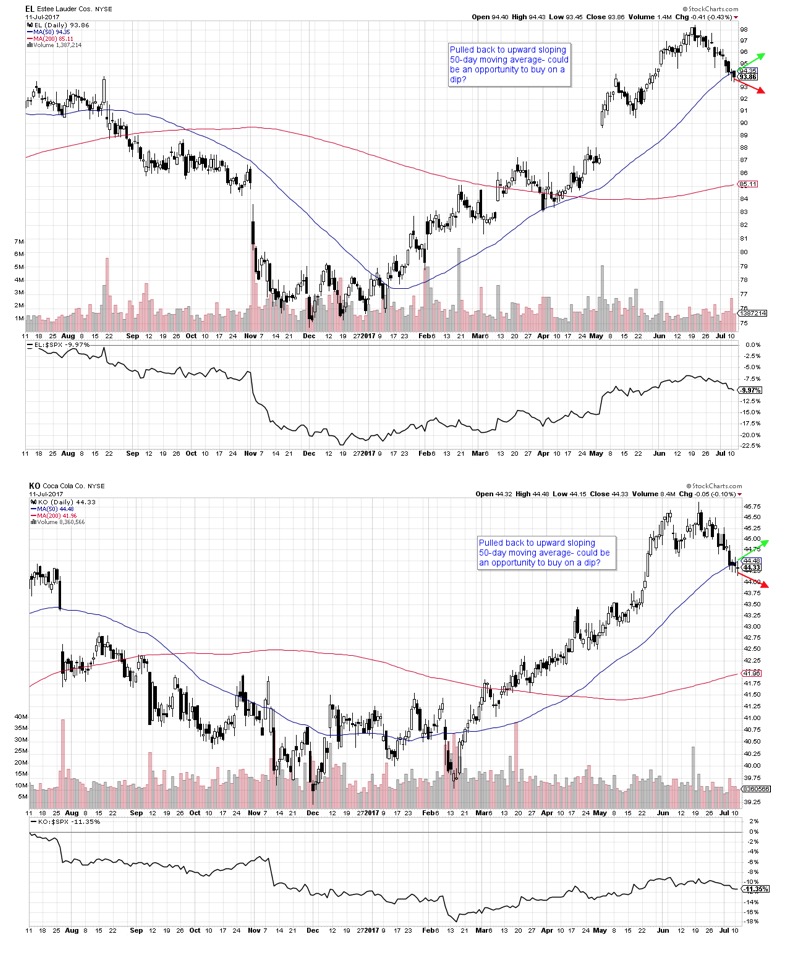
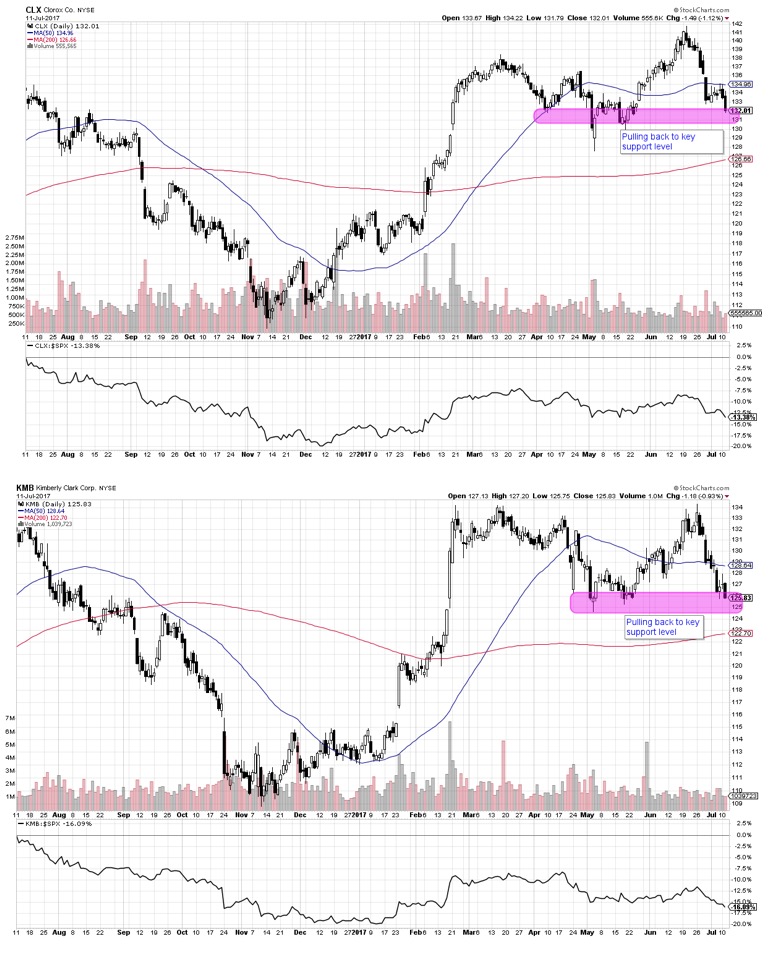
Bucket #2: pulling back to key support levels
These are names that have pulled back to key support levels- either the 50-day moving average or a significant price level- but have not broken down convincingly yet. These remain on the “wait and see” list. I used daily charts so you can see the support levels more clearly.
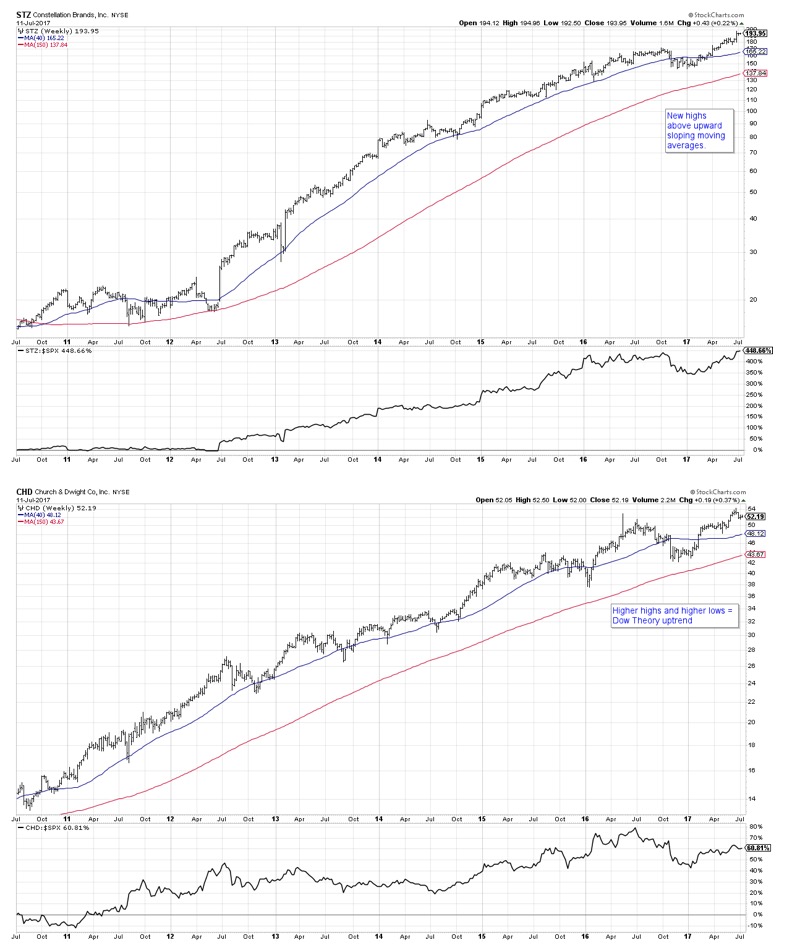
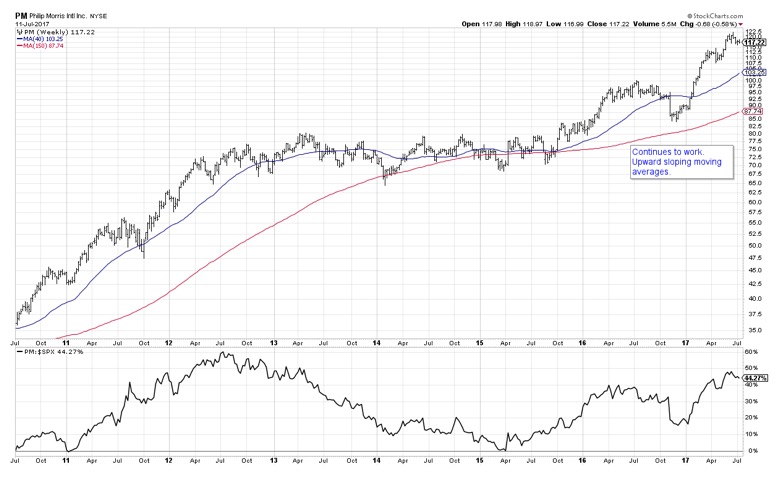
 Bucket #3: charts that actually look constructive
So what’s most interesting when a sector looks weak is to find charts that actually look constructive. Here are names that are in a general uptrend with overall constructive technical configurations.
By combining the top down power of an RRG chart with the rigor of individual stock analysis, you will find that you’re better able to understand the overall themes in the market as well as identify opportunities with individual names.
David Keller, CMT
marketmisbehavior.com
David Keller, CMT is passionate about viewing the markets through the lenses of behavioral psychology and technical analysis. He is a Past President of the Market Technicians Association and currently serves as a Subject Matter Expert for Behavioral Finance. David was formerly a Managing Director of Research at Fidelity Investments in Boston as well as a technical analysis specialist for Bloomberg in New York. You can follow his thinking at marketmisbehavior.com.
Disclaimer: This blog is for educational purposes only, and should not be construed as financial advice. The ideas and strategies should never be used without first assessing your own personal and financial situation, or without consulting a financial professional.