
SPX Monitoring purposes; Long SPX on 3/24/17 at 2343.98.
Monitoring purposes GOLD: Sold GDX at 24.33 on 2/22/07 = gain 20.15%; Long GDX on 12/28/16 at 20.25.
Long Term Trend monitor purposes: Neutral.
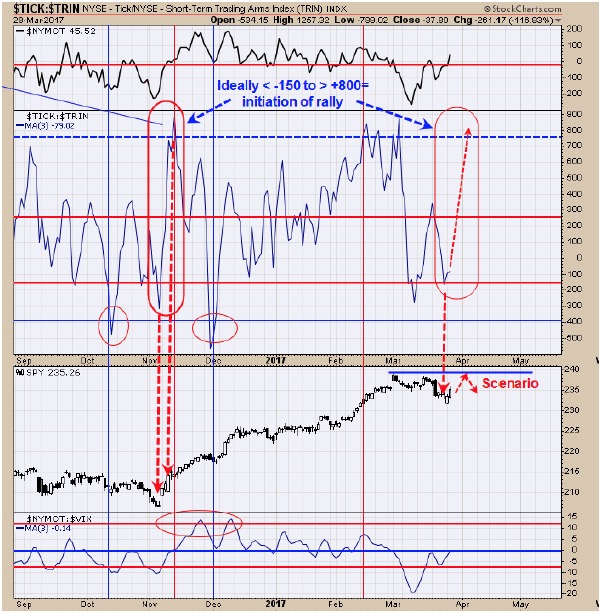
The middle window is the Tick/Trin ratio with a 3 period MA. Readings below -150 suggests a low is near which was reached yesterday. Ideally a trader would like to see the Tick/Trin ratio reach above +800 shortly after a low as that condition would imply an initiation of an uptrend. This condition showed up last November. However this go around we don’t think the Tick/Trin ratio will reach +800 as the 240 range reached on March 1 on the SPY had very high volume and high volume high are usually strong resistance. However if the Tick/Trin ratio does manage to reach +800 or higher will suggest the 240 range on the SPY will be exceeded.
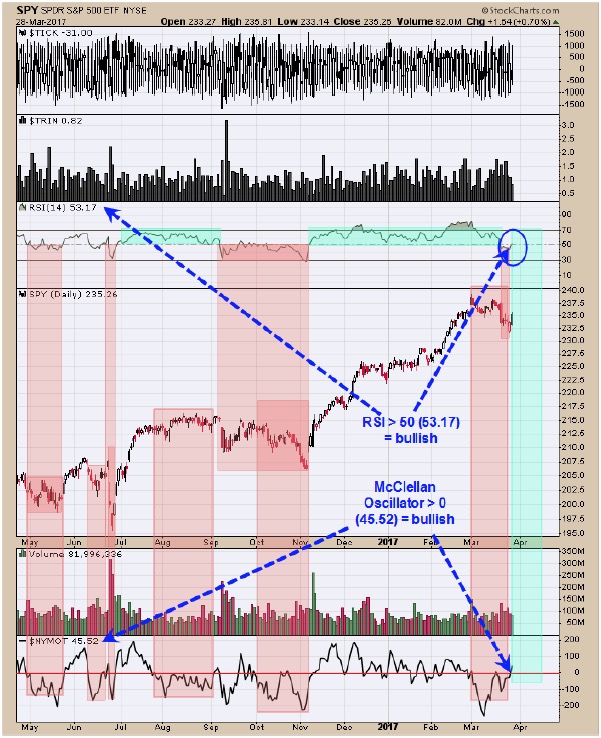 The above chart helps to define the trend for the SPY (SPX). A bullish trend is established when the RSI for the SPY is above 50 (current reading is 53.17) and the McClellan Oscillator is above “0” (current reading is +45.52). As long as the RSI stays above 50 and the McClellan Oscillator stays above 0, the uptrend is in force. For now a possible upside target is the March 1 high on the SPX near 2400.98. Long SPX on 3/24/17 at 2343.98
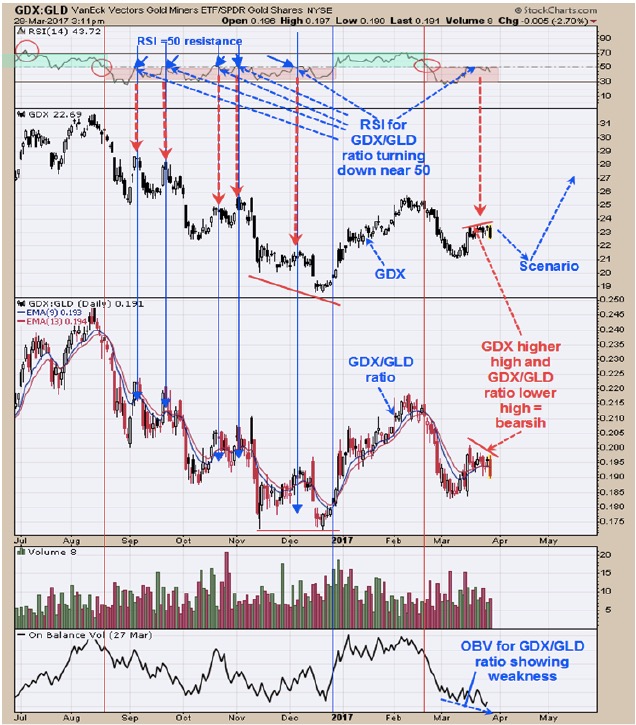 The third window up from the bottom is the GDX/GLD ratio. This ratio normally leads the way for GDX. Recently, GDX/GLD ratio made a lower high as GDX made a higher high and a short term negative divergence. This condition suggests GDX rally may fail. The top window is the RSI for GDX/GLD ratio. Readings above 50 shows GDX/GLD ratio is in an uptrend and bullish and below 50 in a downtrend and bearish. The RSI for the GDX/GLD ratio has been hovering near the 50 range and appears to be turning down and a bearish sign. The bottom window is the On Balance Volume for the GDX/GLD ratio which is making lower lows; suggesting GDX/GLD ratio may weaken more. If GDX/GLD ratio weakens so should GDX. A pull back for GDX appears to be in the making. Timer Digest has us ranked #1 in performance for gold over the last 12 months. Sold GDX at 24.33 on 2/22/17 = gain 20.15%; Long GDX on 12/28/16 at 20.25.
Tim Ord
Editor
For examples in how "Ord-Volume" works, visit www.ord-oracle.com. New Book release "The Secret Science of Price and Volume" by Timothy Ord, buy on www.Amazon.com