Top Advisors Corner October 30, 2015 at 02:39 PM
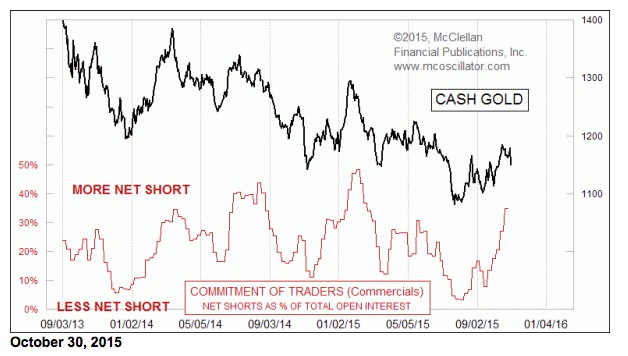
There has been a rapid movement over the past few weeks by commercial traders of gold futures to increase their net short position as a group. That is a development which has importance for the future of gold prices... Read More
Top Advisors Corner October 28, 2015 at 02:52 PM
Monitoring purposes SPX: Sold on 10/5/15 at 1987.05; gain 2.28%. long SPX on 9/22/15 at 1942.74... Read More
Top Advisors Corner October 28, 2015 at 02:49 PM
Once again the fed sent a not so great message with her refusal to raise rates. She not only refused to raise a whopping quarter of a percent now but she said she may not raise when they meet again in December... Read More
Top Advisors Corner October 23, 2015 at 09:30 AM
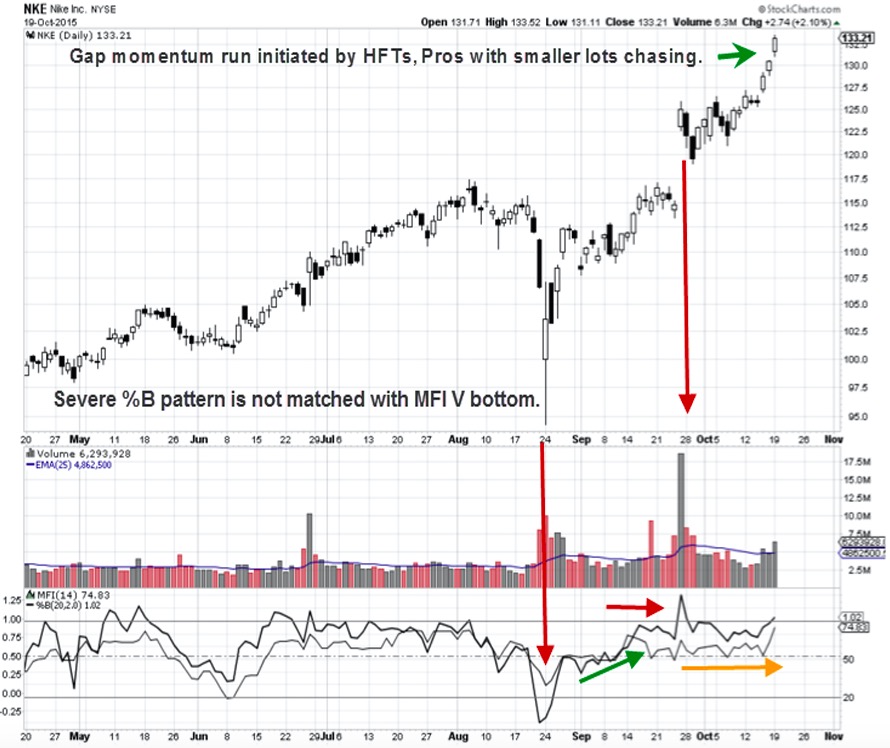
Using %B with MFI Indicator Many traders use Bollinger Bands to help them find compression patterns for momentum breakout trading strategies. Bollinger Bands are one of the most reliable and flexible channel indicators for Momentum Trading... Read More
Top Advisors Corner October 21, 2015 at 01:28 PM
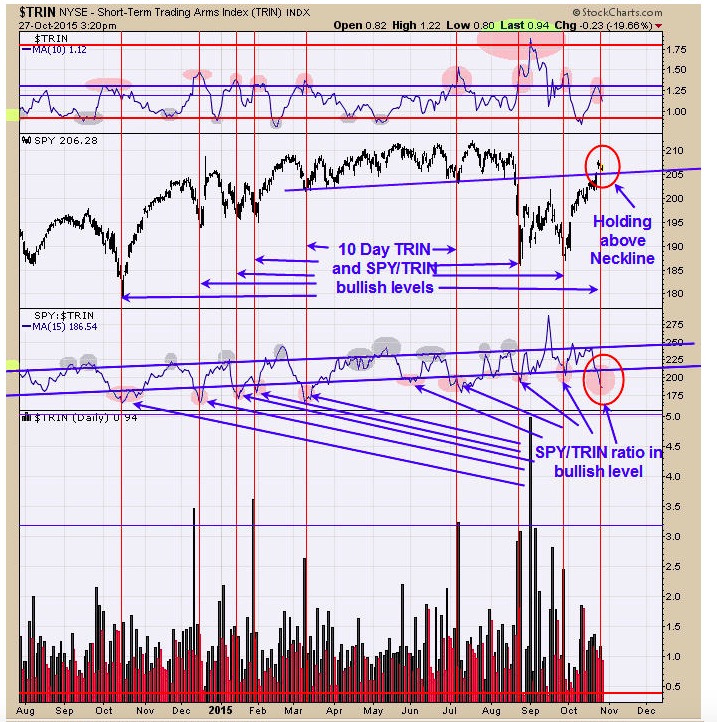
The battle zone levels have been established. The Nasdaq at 4900 or the mid point of the double bottom range and 2030 to 2050 on the Sp 500 or the two hundred day exponential moving average and down trend line... Read More
Top Advisors Corner October 21, 2015 at 07:52 AM
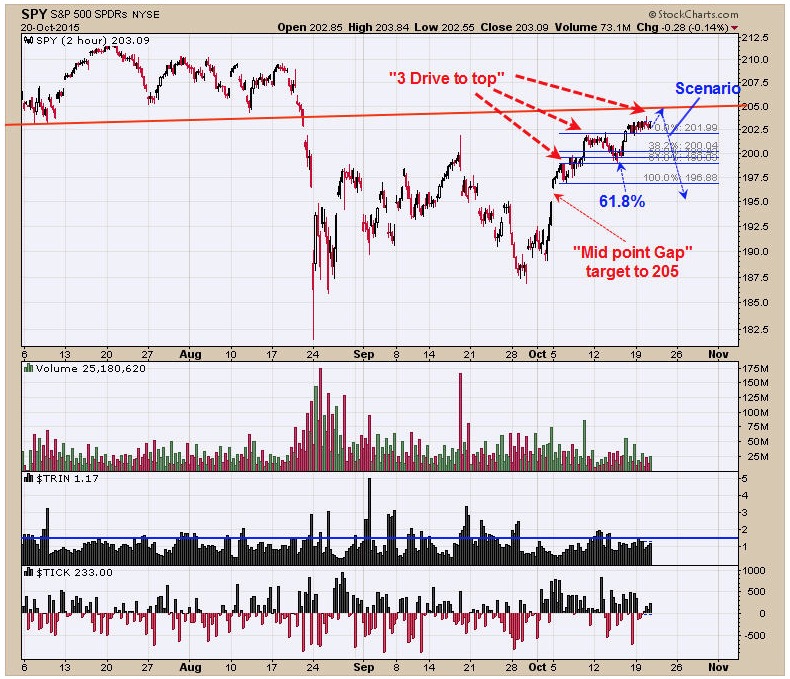
Monitoring purposes SPX: Sold on 10/5/15 at 1987.05; gain 2.28%. long SPX on 9/22/15 at 1942.74. Monitoring purposes GOLD: Flat Long Term Trend monitor purposes: Flat The chart above is the two hour chart of the SPY... Read More
Top Advisors Corner October 19, 2015 at 02:05 PM
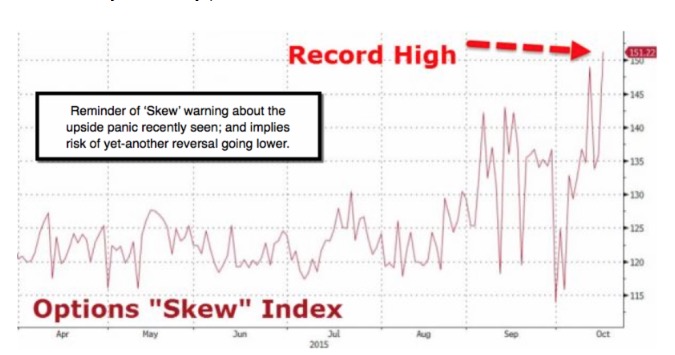
A returning 'spell' of illiquidity - was thought on-tap to bode poorly for S&P and broad market behavior; without bears being spooked until Halloween... Read More
Top Advisors Corner October 19, 2015 at 08:36 AM
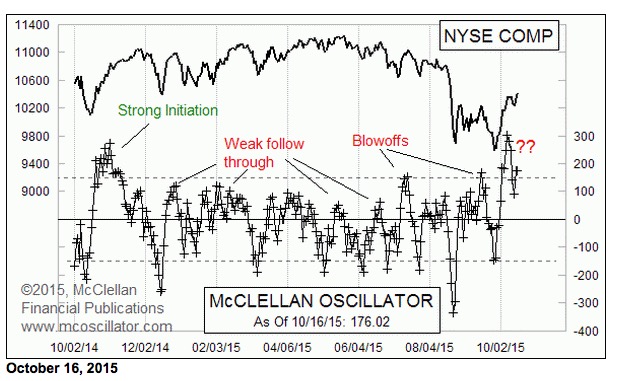
We have learned a lot about the behavior of the McClellan A-D Oscillator since my parents, Sherman and Marian McClellan, brought it to the public back in 1969... Read More
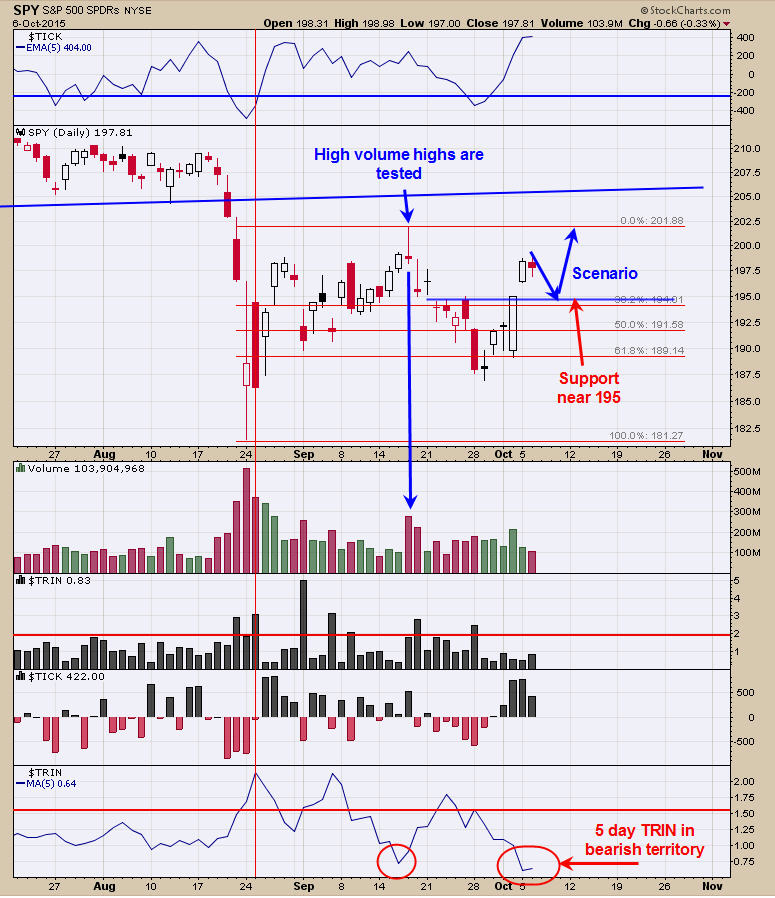
Top Advisors Corner October 16, 2015 at 11:57 AM
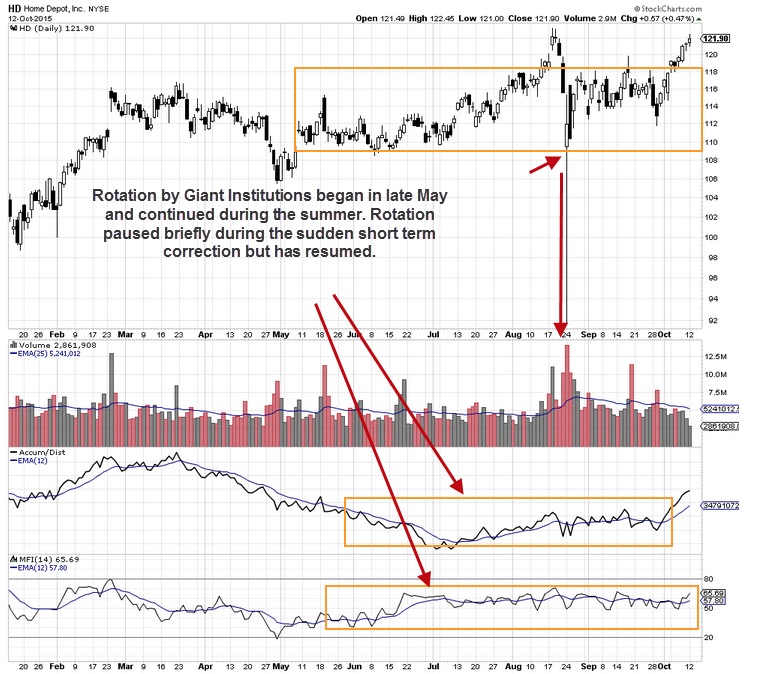
Volume Bars Analysis It used to be that price was the most important indicator on a stock chart. Most stock indicators, market breadth indicators, and sector indicators are based solely on price and time due to the importance weighted on price action in the past... Read More
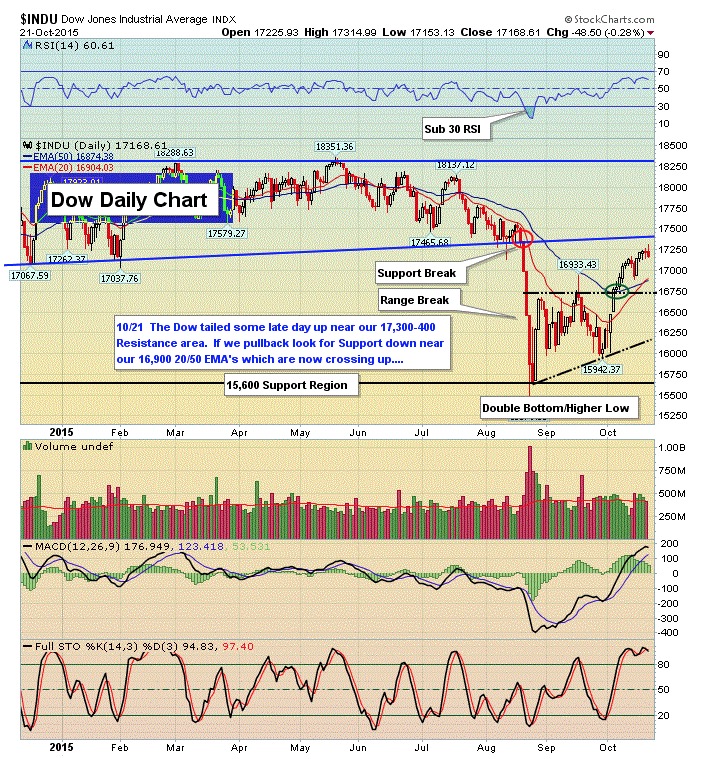
Top Advisors Corner October 14, 2015 at 12:53 PM
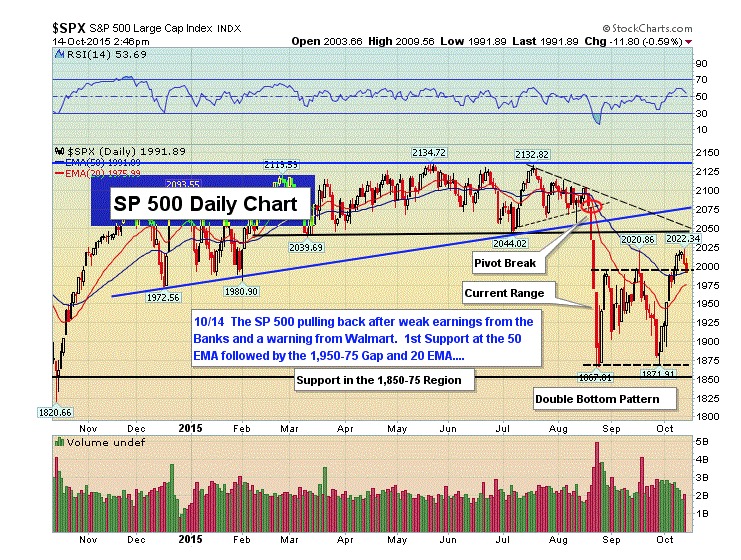
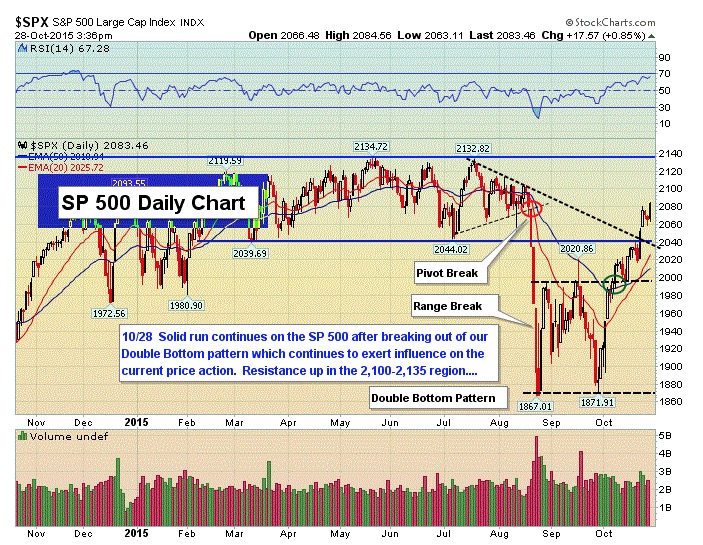
After a run up off the 1,870 lows area the market started to show some hesitation the past couple of sessions and our sense was the market wanted to see what earnings season was going to bring to the table... Read More
Top Advisors Corner October 14, 2015 at 08:02 AM
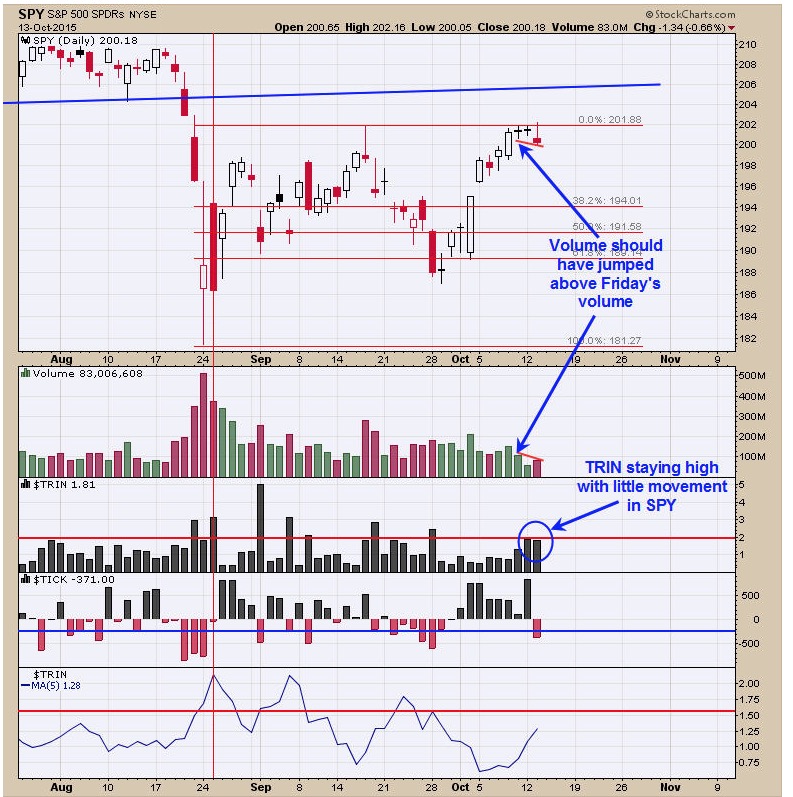
Monitoring purposes SPX: Sold on 10/5/15 at 1987.05; gain 2.28%. long SPX on 9/22/15 at 1942.74. Monitoring purposes GOLD: Flat Long Term Trend monitor purposes: Flat The SPY pulled back today and closed below the last two lows... Read More
Top Advisors Corner October 12, 2015 at 09:06 AM
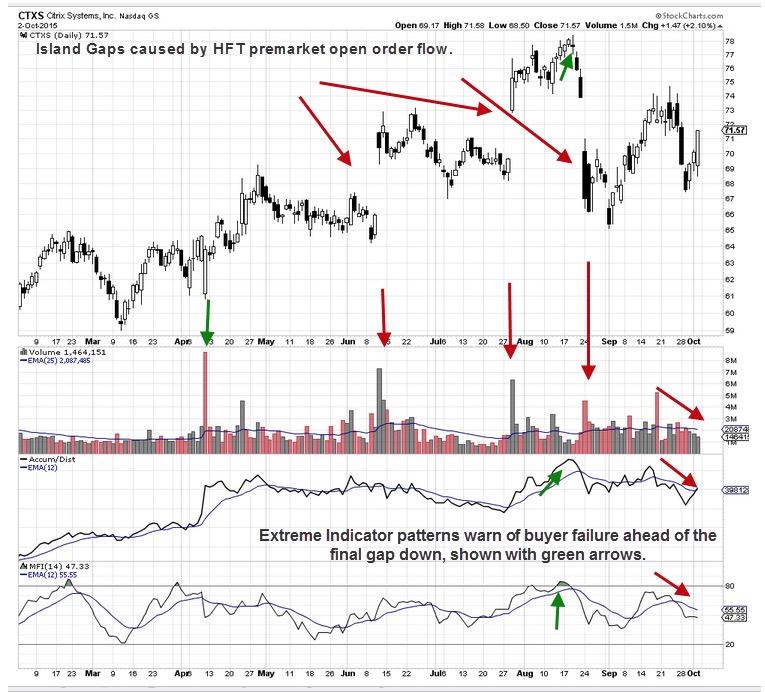
How to interpret Island Gap Patterns Island Gaps on candlestick charts occur when price is adjusted ahead of the market open. The change of price usually occurs during pre-market activity, as much as 3-4 hours ahead of the open. Gaps are caused by the following: 1... Read More
Top Advisors Corner October 09, 2015 at 04:15 PM
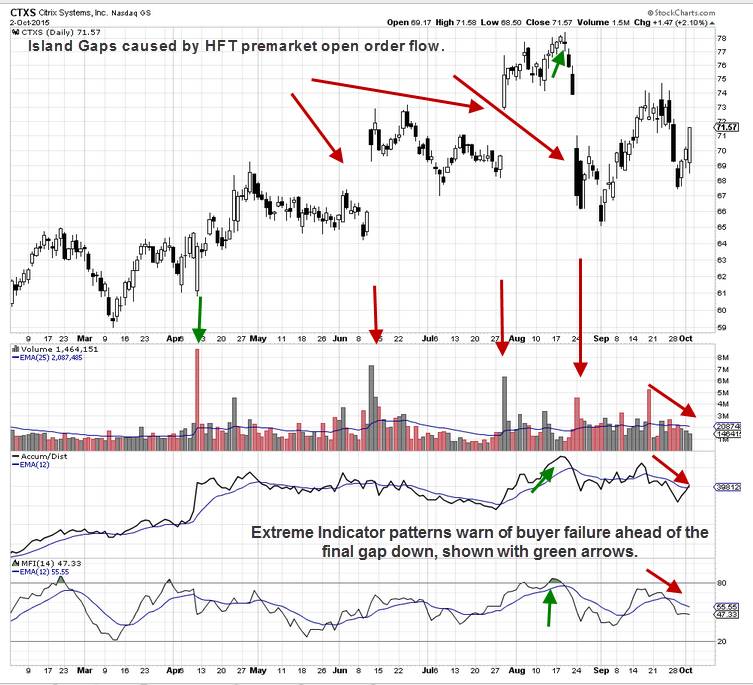
Island Gaps on candlestick charts occur when price is adjusted ahead of the market open. The change of price usually occurs during pre-market activity, as much as 3-4 hours ahead of the open... Read More
Top Advisors Corner October 09, 2015 at 01:15 PM
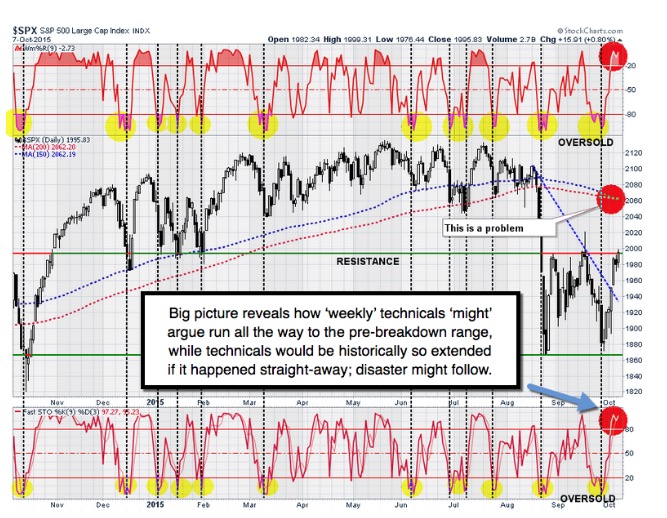
The transition driving markets - continues reflecting schools of thought that reflect competing analytical views of 'what drives the stamina'... Read More
Top Advisors Corner October 09, 2015 at 09:20 AM
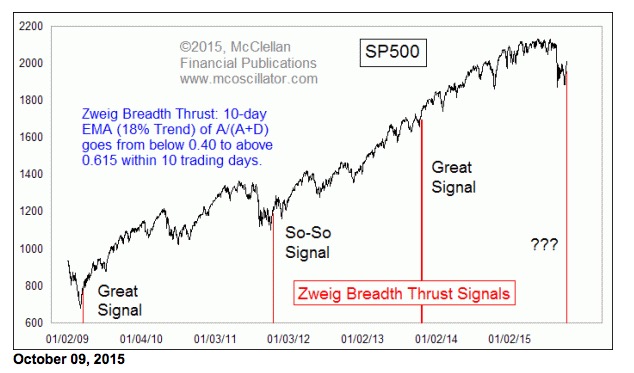
Technicians have a lot of versions of a “breadth thrust” signal, and the basic idea is that the Advance-Decline numbers suddenly go from not so good to REALLY good in a short amount of time... Read More
Top Advisors Corner October 07, 2015 at 02:30 PM
Pessimism Still Very High.....Bulls Enjoying The Negativity Off The Lows.....Earnings Time Is Upon Us.... When markets get overly optimistic, meaning too many bulls, they have a tendency to struggle, even if it takes a while before they go down appreciably... Read More
Top Advisors Corner October 07, 2015 at 02:30 PM
Monitoring purposes SPX: Sold on 10/5/15 at 1987.05; gain 2.28%. long SPX on 9/22/15 at 1942.74... Read More
Top Advisors Corner October 02, 2015 at 10:56 AM
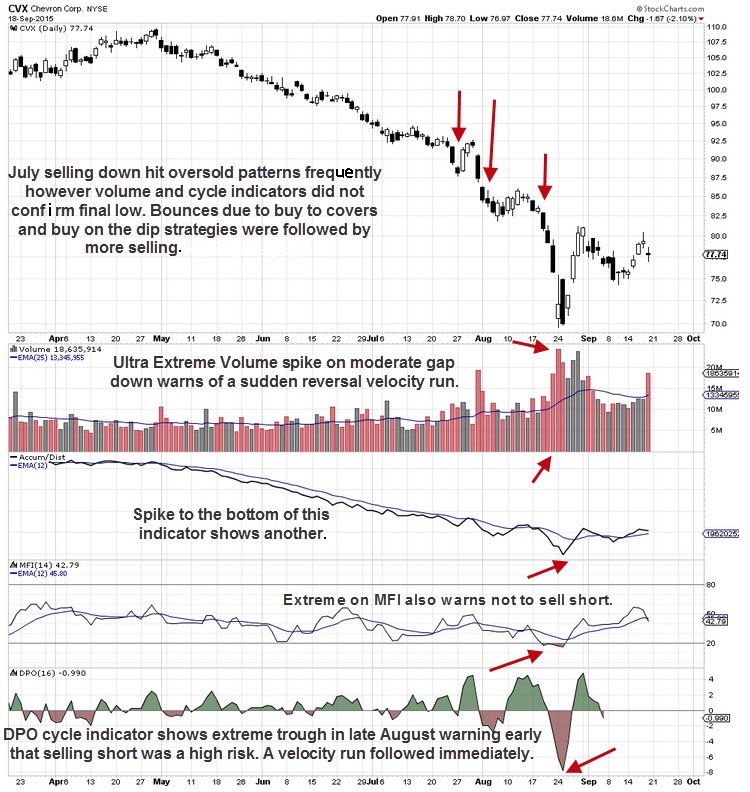
Detrending Price Oscillator Indicator for Bottoming Patterns One of the crucial requirements for swing and day traders is the ability to identify the commencement of a bottom in a stock chart candlestick pattern. This offers two huge advantages to the technical trader. 1... Read More