
Introduction
We need another close below 119 to confirm the potential quadruple top in Apple. We can use this breakdown to develop some down-side price targets.
Three downside targets
Using a $13 price range (approximately $134 to $121), gives a down-side target of $108 or so, which also coincides roughly with a 61.8% retracement using the Oct-14 low (see Figure 1). Hence, we can project a $109 to $108 down-side target as a first approximation.
Moving out in time, we can find a target for a deeper correction using the Feb-14 low which occurred just before the major breakout leading to the current quadruple top. The 38.2% retracement from that low puts is in the $108 area, adding another point to the estimated price cluster (see Figure 2).
The next strong downside target is in the $101 area, where price resistance can become new support.
Summary
Thus, pending confirmation of the breakdown, a downside target of $108-$109 is reachable due to cluster of price estimates from the height of the pattern and Fibonacci retracements.
Reference
Additional comparisons to forecasts from automated technical analysis are here: http://www.etfmeter.com/blog.aspx?id=4402
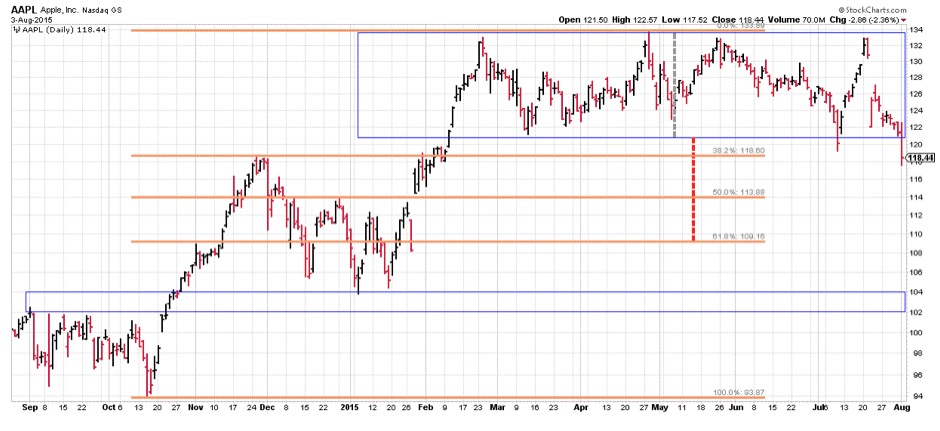
Figure 1: Due to the complex quadruple top, there is some ambiguity about exactly where to draw the lower line. However, using the Oct-14 low and Apr-15 high, we get a 61.8% retracement target of about 109, which puts us in the 108-109 area off a $13 price range ($134-$121).
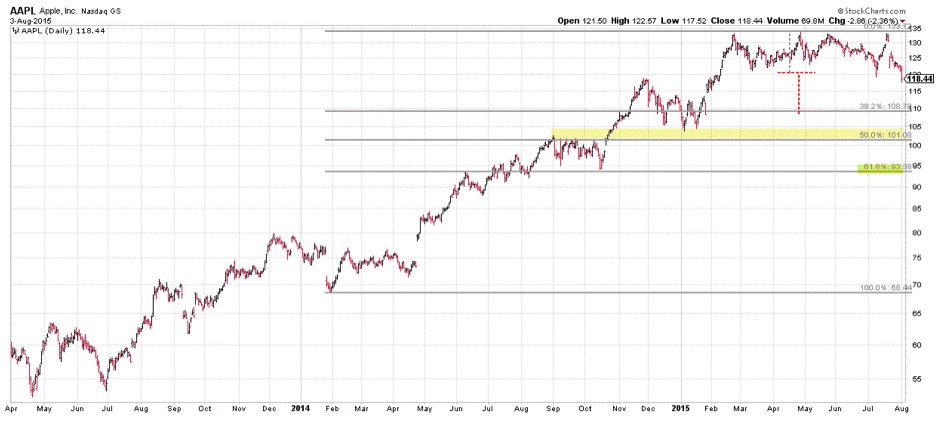
Figure 2: We get another set of retracement targets using the Feb14 low for reference. Here the 38% retracement coincides with the 62% retracement in Figure 1 and the downside price projection from the rectangular consolidation. The 50% retracement at $101 is another strong target, where prior resistance can become new support.
Tushar Chande
ETFmeter.com
chande@ETFmeter.com