TAKEAWAYS
- Consumer staples and utilities continue to lead sector rankings.
- Defensive sectors are showing strength in both weekly and daily RRGs.
- Health care struggling, but maintains position in top 5
- RRG portfolio slightly underperforming S&P 500 YTD, but gap narrowing.
Top 5 Remains Unchanged
The latest sector rotation analysis reveals a market that's still playing defense. Despite some minor shuffling in the lower ranks, the top five sectors remain unchanged this week—a sign that the current defensive positioning is settling into a more stable pattern.
Consumer staples is holding its ground at the number one spot, followed by utilities, financials, communication services, and health care. This lineup underscores the market's continued preference for defensive plays.
- (1) Consumer Staples - (XLP)
- (2) Utilities - (XLU)
- (3) Financials - (XLF)
- (4) Communication Services - (XLC)
- (5) Healthcare - (XLV)
- (6) Real-Estate - (XLRE)
- (8) Industrials - (XLI)*
- (9) Consumer Discretionary - (XLY)*
- (10) Materials - (XLB)*
- (7) Energy - (XLE)*
- (11) Technology - (XLK)
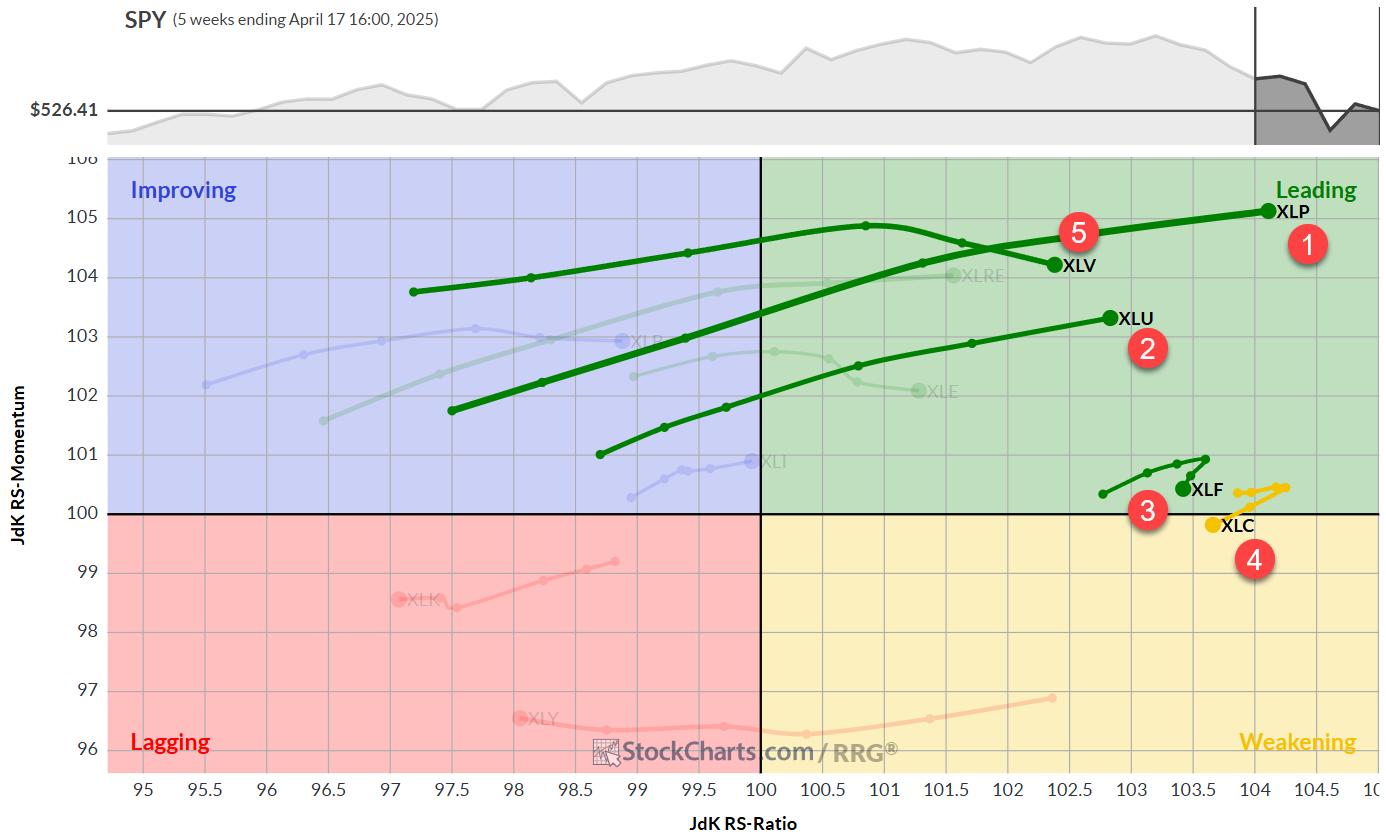
Weekly RRG
The weekly Relative Rotation Graph (RRG) paints a clear picture of the defensive sectors' strength. Consumer staples and utilities are continuing to move further into the leading quadrant, solidifying their dominant positions. Healthcare, while ranked fifth, is located within the leading quadrant, but has lost some relative momentum over the past two weeks — something to keep an eye on.
Interestingly, financials and communication services, ranked third and fourth respectively, are showing signs of momentum loss, despite maintaining elevated RS ratio levels. Communication services have actually crossed into the weakening quadrant this week. At current RS-Ratio levels, this is not too concerning yet.
Daily RRG: Staples and Utilities Slightly Losing Relative Momentum
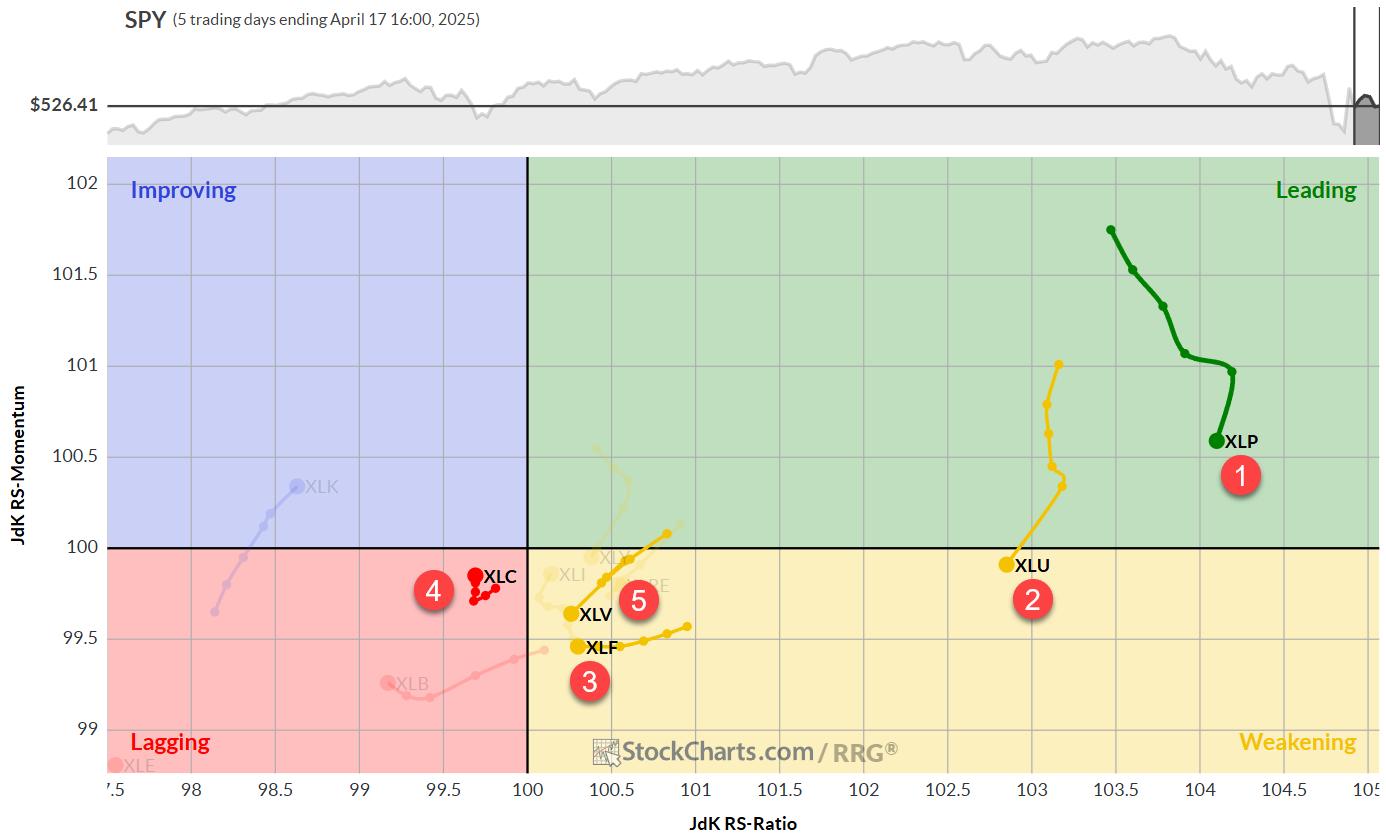
Zooming in on the daily RRG provides some nuanced insights. Staples and utilities, while still disconnected from other sectors at high RS ratio levels, have lost some relative momentum in the last week. Utilities have dipped into the weakening quadrant on this timeframe, but, given its high relative strength (RS) ratio, it's not a major concern, at least not yet.
Financials and health care are also in the weakening quadrant on the daily RRG, but they're flirting with the 100 level on the RS ratio scale. We haven't seen a crossover yet, but it's definitely a situation to be aware of.
One bright spot: communication services, despite being in the lagging quadrant, is showing signs of rolling back up. This aligns with its positive heading on the weekly RRG, suggesting potential improvement ahead.
Consumer Staples (XLP)
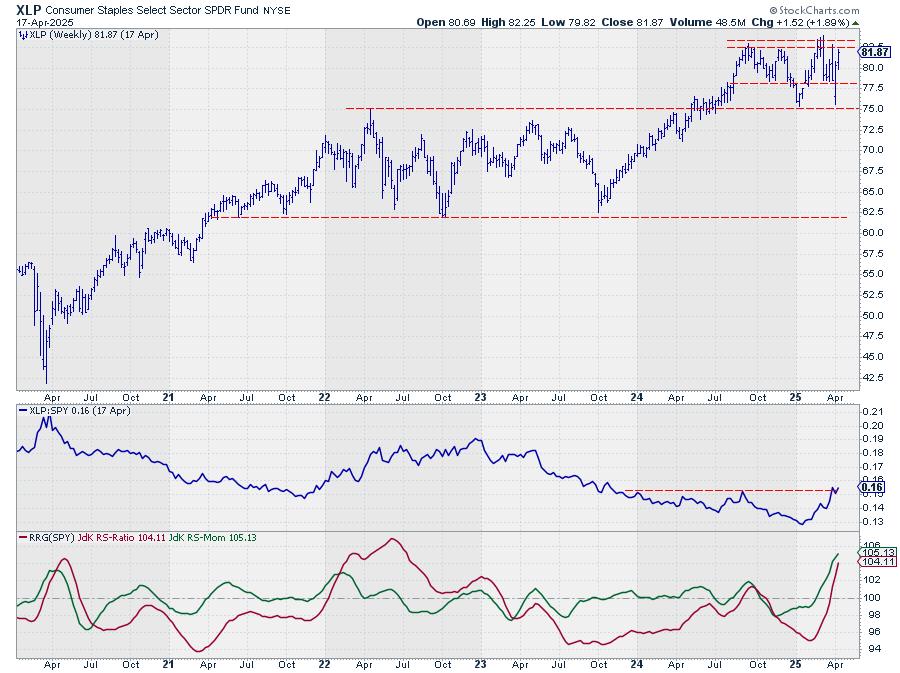
XLP is flexing its muscles, pushing against overhead resistance—a show of strength, given the S&P 500's weakness. A break above the 83 area could unlock more upside potential, further cementing Staples' defensive appeal. The relative strength line is attempting to break above horizontal resistance, dragging both RRG lines higher and pushing XLP deeper into the leading quadrant.
Utilities (XLU)
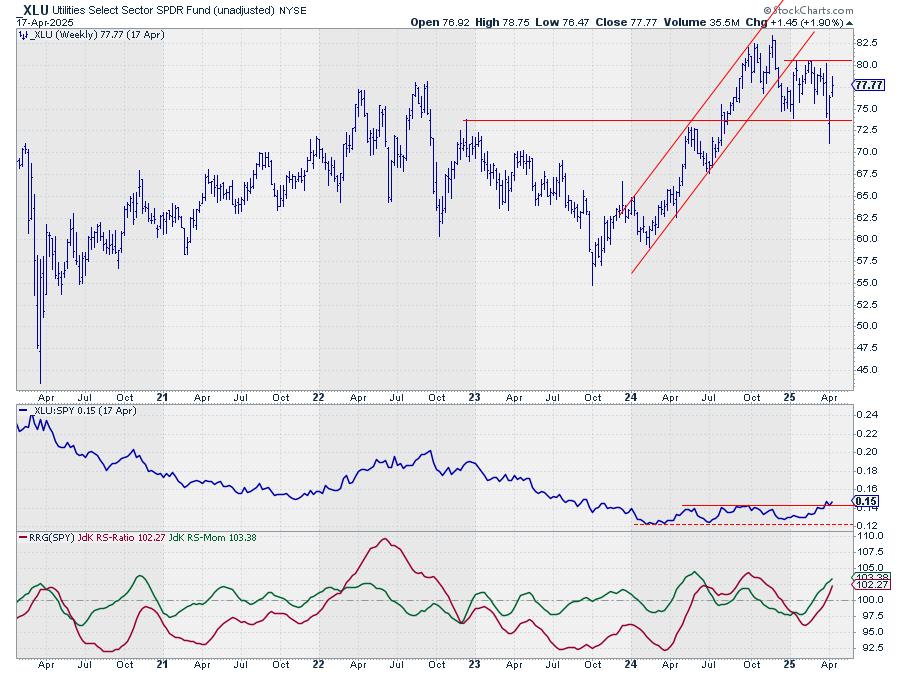
Utilities are showing a similar pattern to staples, though not quite as robust. XLU has retreated into its trading range, between roughly 73 and 80, currently sitting in the mid-range. Given the broader market weakness, this is still a positive setup for utilities. The sector is attempting to break above its relative resistance, which is propelling the RRG lines above 100 and deeper into the leading quadrant.
Financials (XLF)
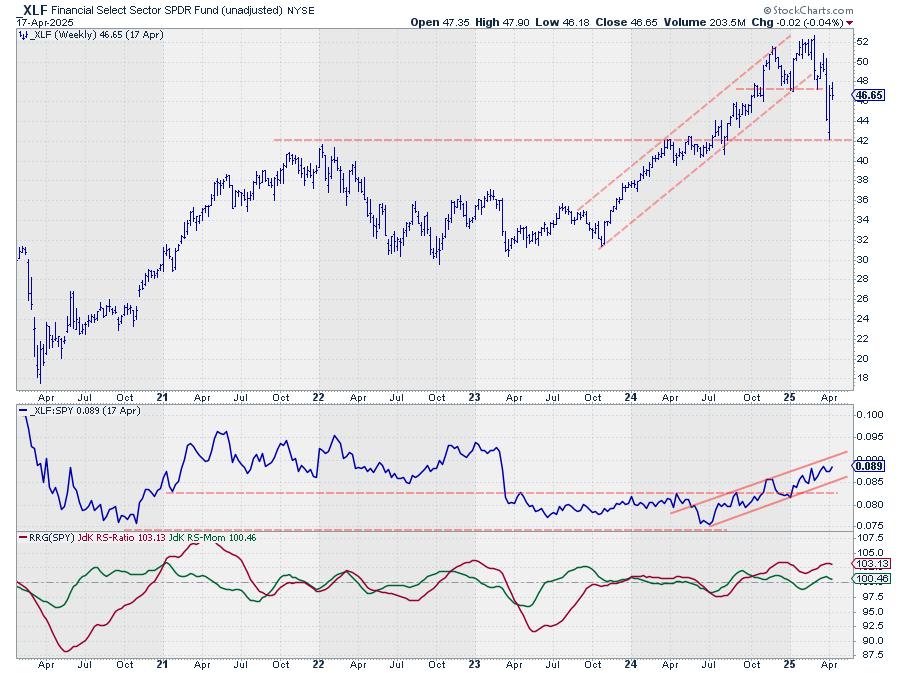
Financials took a hit but found support around 42, bouncing strongly back towards the 47-47.50 resistance area. This sets up a limited upside potential, but the downside seems well-protected for now. The raw relative strength uptrend remains intact, keeping XLF in the leading quadrant, despite some leveling off of the RRG lines.
Communication Services (XLC)
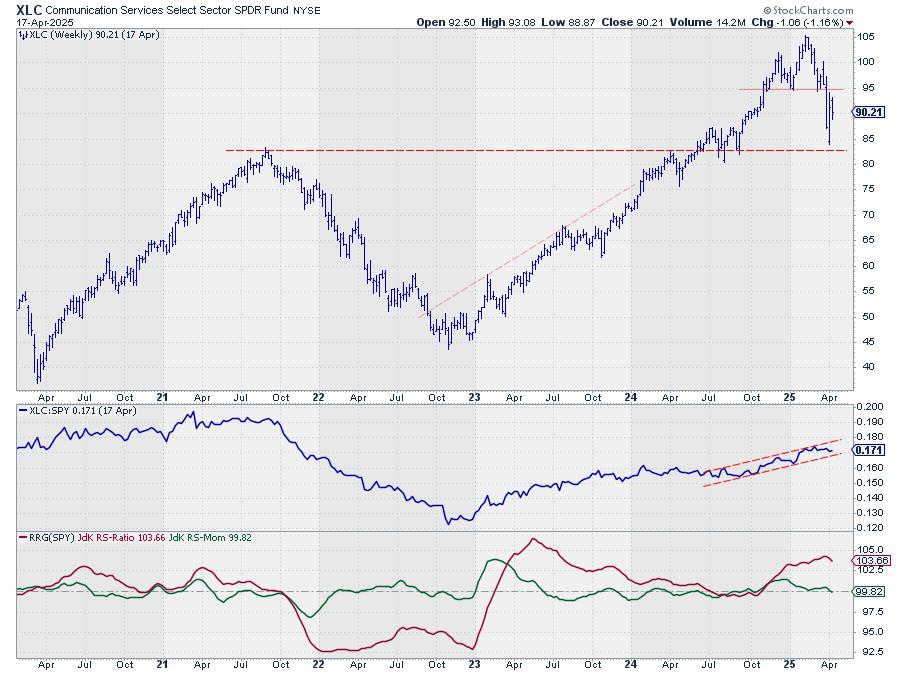
XLC has been the biggest loser among the top sectors, breaking support around 95 and declining rapidly to support near 82.50. We're currently seeing a bounce off that support. Relative strength is maintaining its rising channel, keeping the RS ratio well above 100. However, the momentum line has dipped below 100, temporarily pushing XLC into the weakening quadrant. The uptrend in relative strength is still in play, though -- something to watch closely.
Health Care (XLV)
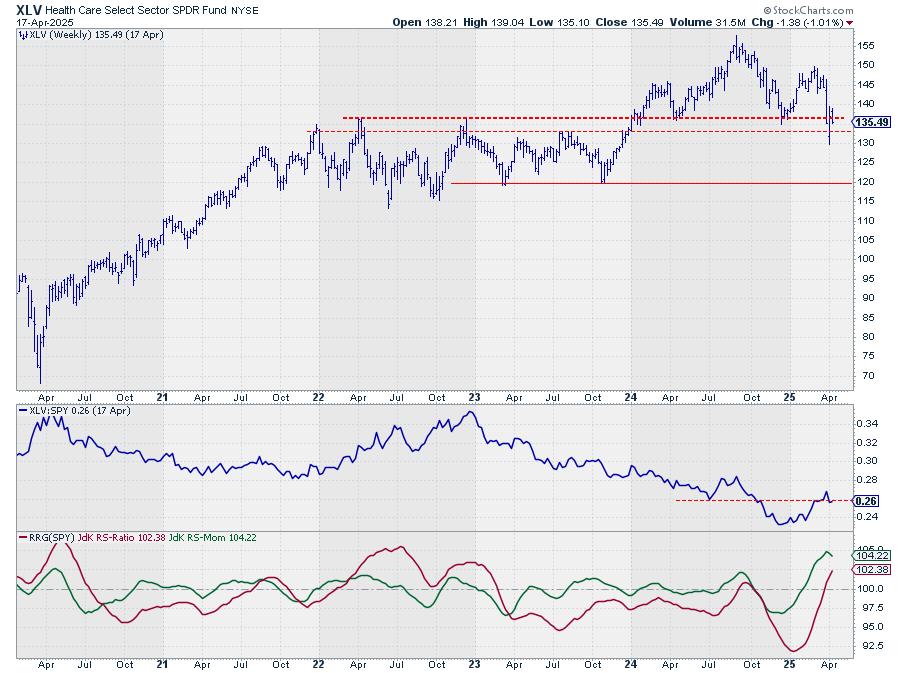
Healthcare is struggling, grappling with support between $132.50 and $135. A potential head-and-shoulders top formation is developing -- a pattern we're seeing in several sectors, to be honest. XLV is clearly the weakest of the top five, explaining its fifth-place ranking. Relative strength is struggling to maintain its upward trajectory. While both RRG lines remain above 100, we need to see a clear break in relative strength and the formation of an uptrend in order for healthcare to maintain its top-five status.
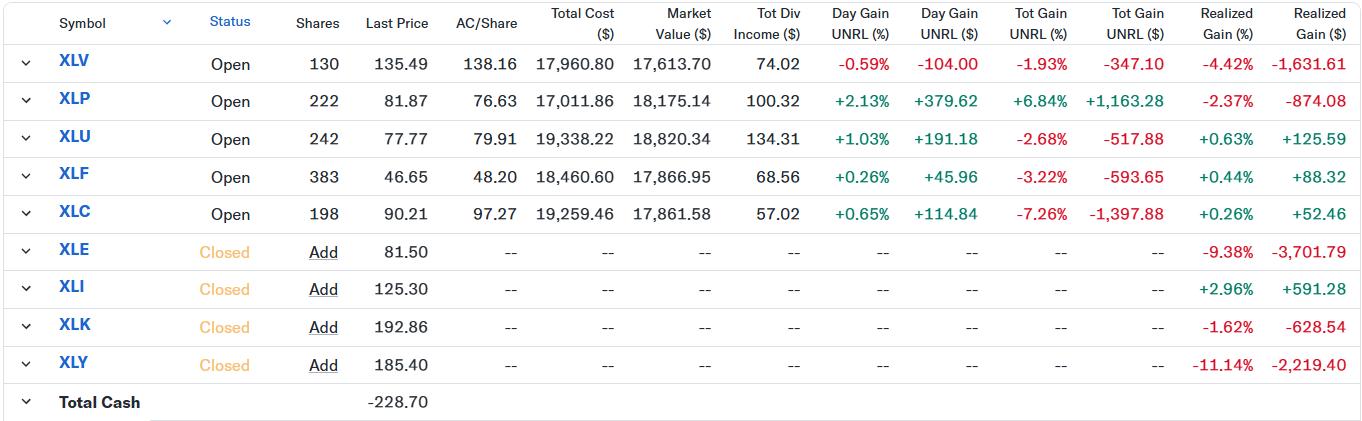
RRG Portfolio Performance
An update on our RRG portfolio of top five sectors: As of Friday's close, the portfolio is down 10.2% year-to-date, compared to the S&P 500's (using SPY as the benchmark) decline of 9.96%. This has resulted in a slight underperformance of 0.2%. However, it's worth noting that we're catching up to the benchmark after last week's more significant underperformance -- we're on the rise again.

#StayAlert --Julius
Julius de Kempenaer
Senior Technical Analyst, StockCharts.com
Creator, Relative Rotation Graphs
Founder, RRG Research
Host of: Sector Spotlight
Please find my handles for social media channels under the Bio below.
Feedback, comments or questions are welcome at Juliusdk@stockcharts.com. I cannot promise to respond to each and every message, but I will certainly read them and, where reasonably possible, use the feedback and comments or answer questions.
To discuss RRG with me on S.C.A.N., tag me using the handle Julius_RRG.
RRG, Relative Rotation Graphs, JdK RS-Ratio, and JdK RS-Momentum are registered trademarks of RRG Research.