RRG Charts February 28, 2025 at 03:28 PM

In this exclusive StockCharts video, Julius analyzes seasonality for U.S. sectors and aligns it with current sector rotation. He explores how these trends impact the market (SPY) and shares insights on potential movements using RRG analysis... Read More
RRG Charts February 24, 2025 at 09:08 AM
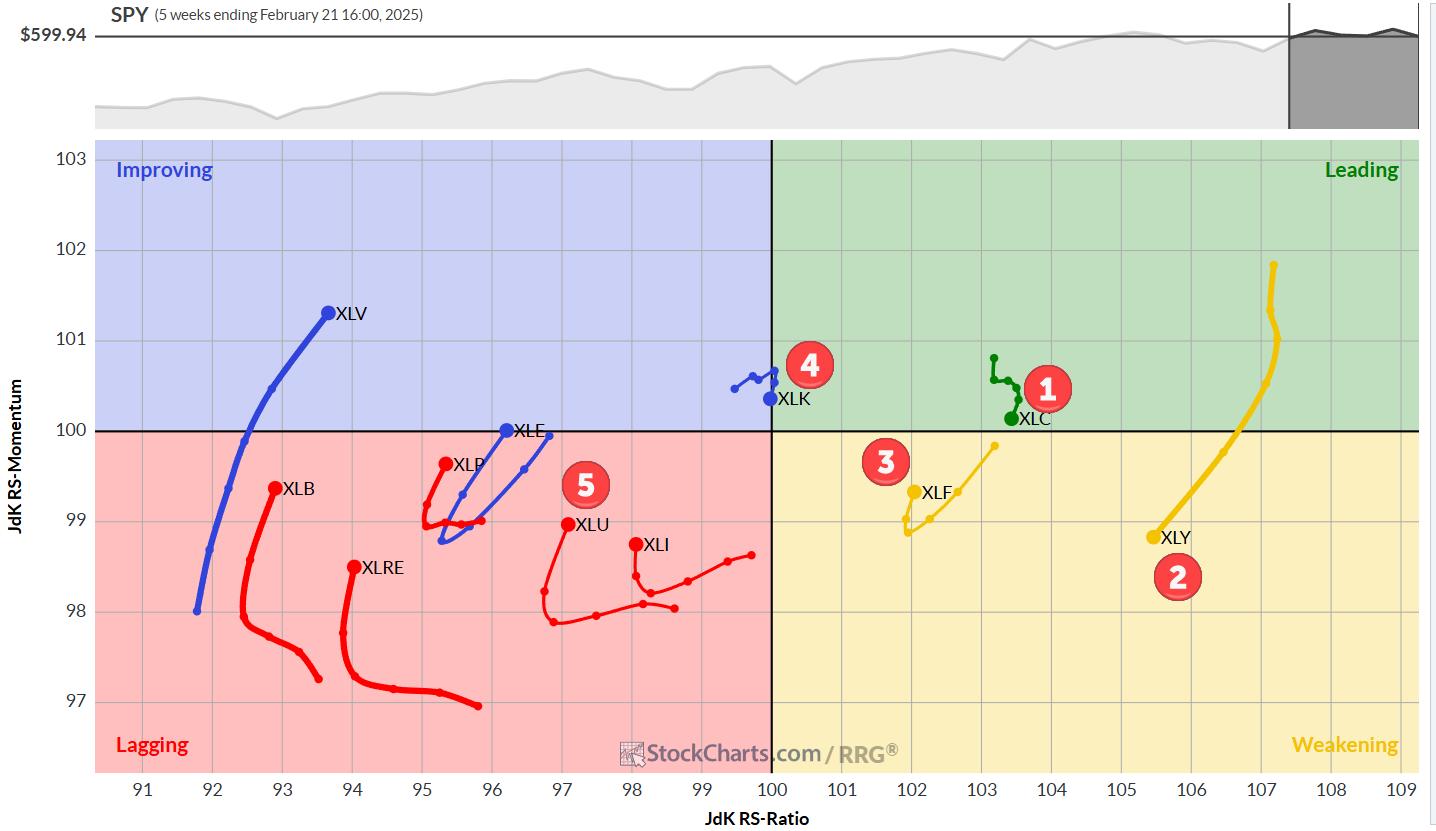
Utilities enter top 5 Last week's trading, especially the sell-off on Friday, has caused the Utilities sector to enter the top 5 at the cost of Industrials... Read More
RRG Charts February 21, 2025 at 04:46 PM
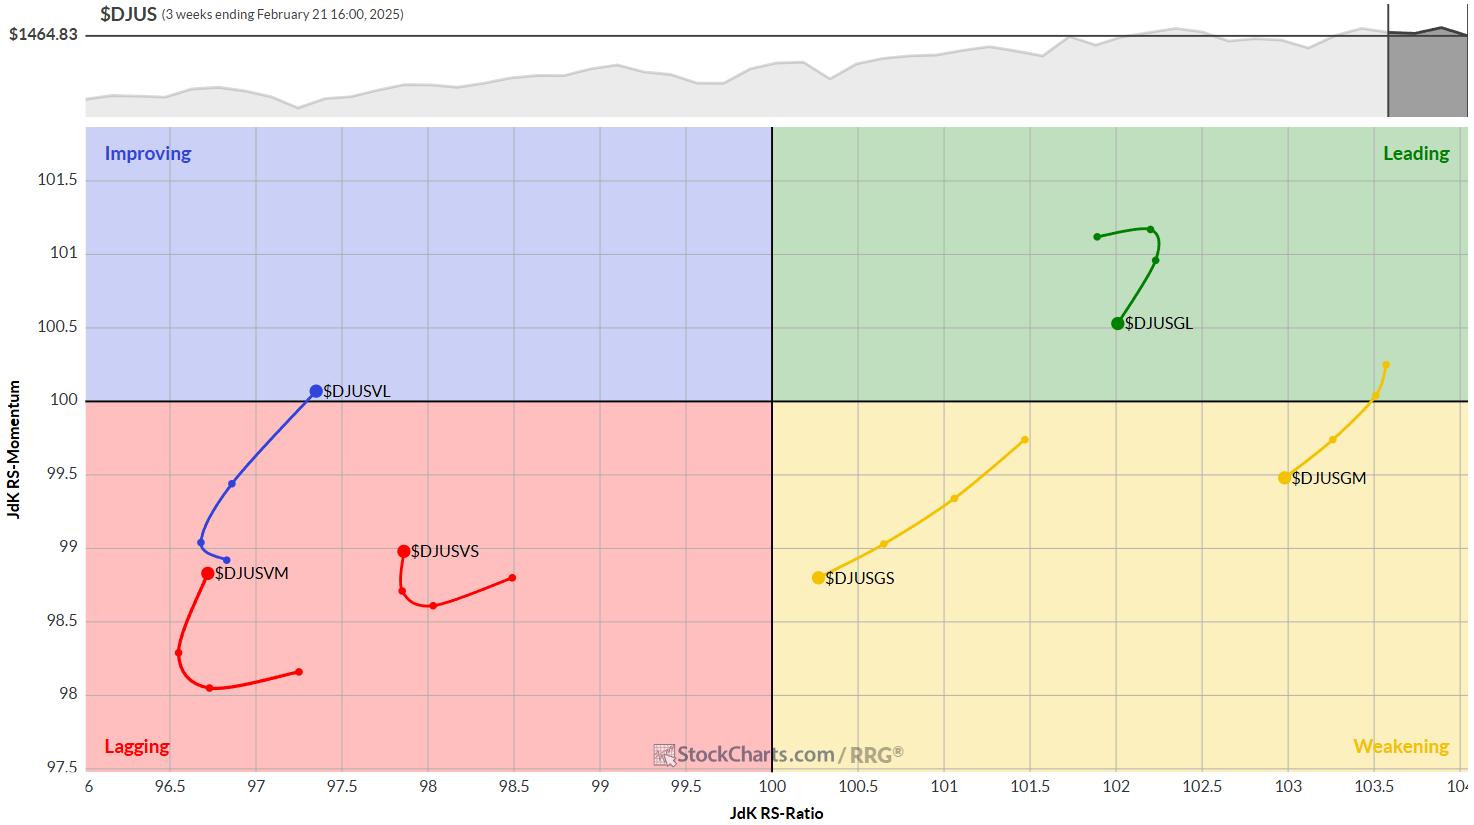
With the market selling off into the close today, it's too early to write my usual "best five sectors" article. The risk of ranking changes is too high. I will make sure that an update will be posted before the markets open on Monday... Read More
RRG Charts February 17, 2025 at 02:02 PM
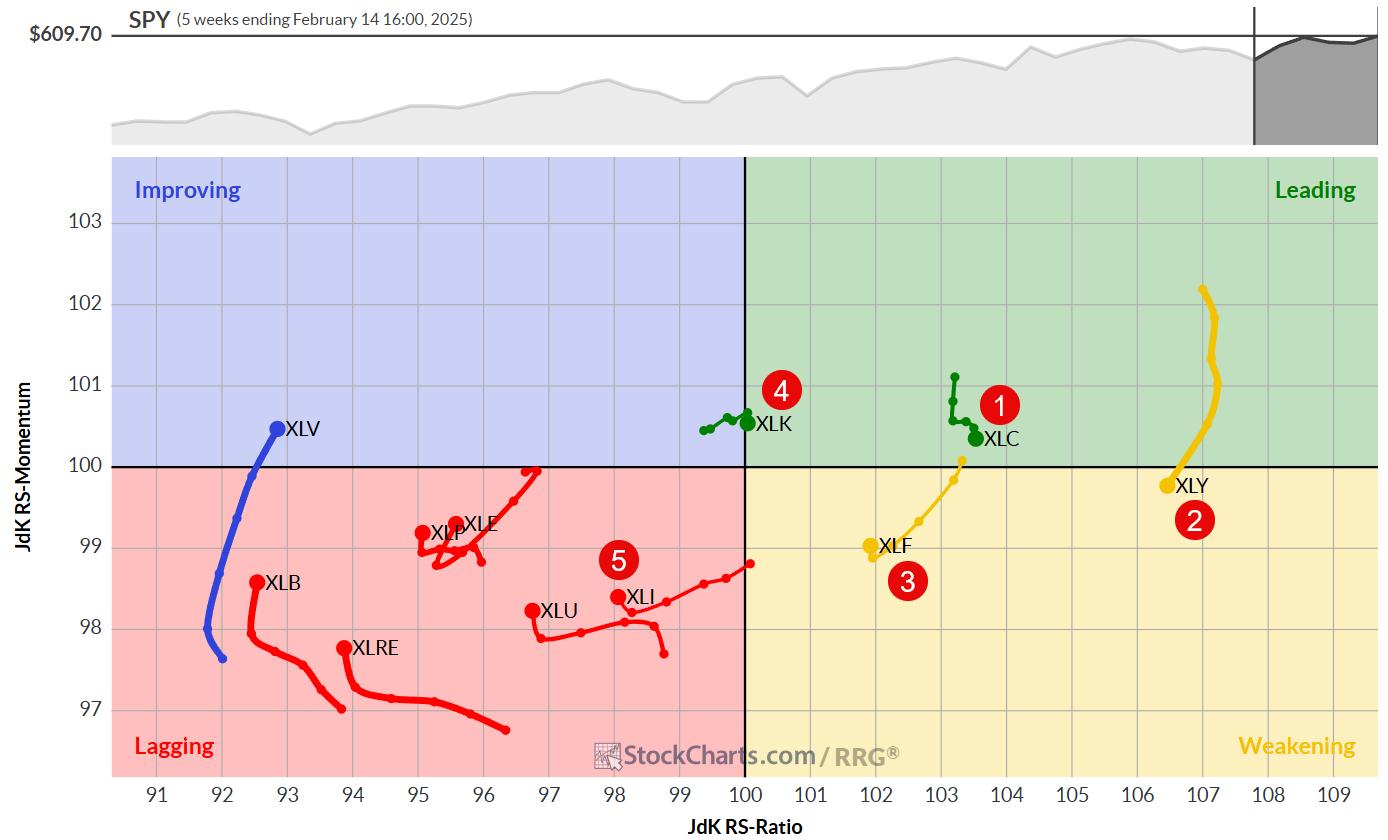
Shifting Sands in the Top Five At the end of last week, there were some interesting shifts in sector positioning, though the composition of the top five remained unchanged... Read More
RRG Charts February 10, 2025 at 09:45 AM
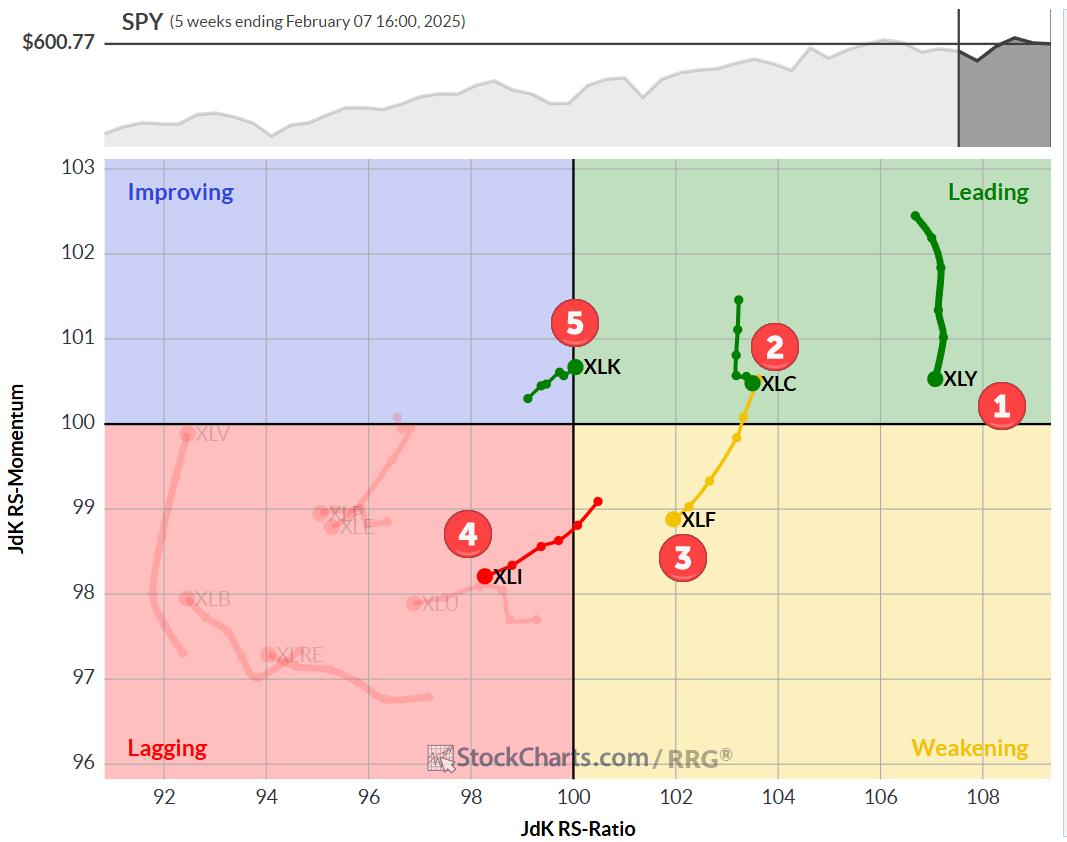
No Changes In Top-5 At the end of the week ending 2/7, there were no changes in the top-5, but there have been some significant shifts in the bottom 5 sectors... Read More
RRG Charts February 04, 2025 at 06:04 PM
In this exclusive StockCharts video, Julius shares a new approach to seasonality by using a more granular, data-set constructed UDI (User Defined Index) for every sector. Using the UDI functionality on StockCharts... Read More