RRG Charts September 27, 2024 at 11:00 AM

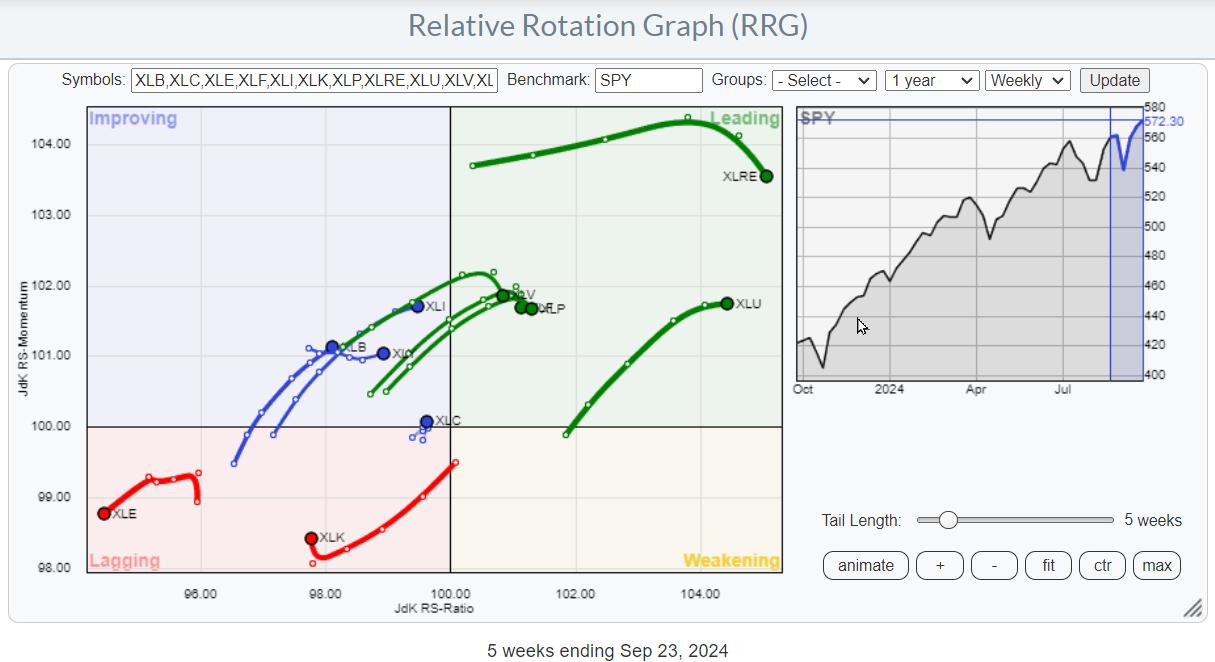
Despite a backdrop of conflicting market signals, there are still sectors within the S&P 500 that are showing promising movements and potential opportunities for investors... Read More
RRG Charts September 24, 2024 at 05:23 PM

In this video from StockCharts TV, Julius assesses current rotations in asset classes and US sectors using Relative Rotation Graphs, finding a lot of contradictory behavior... Read More
RRG Charts September 20, 2024 at 04:11 PM

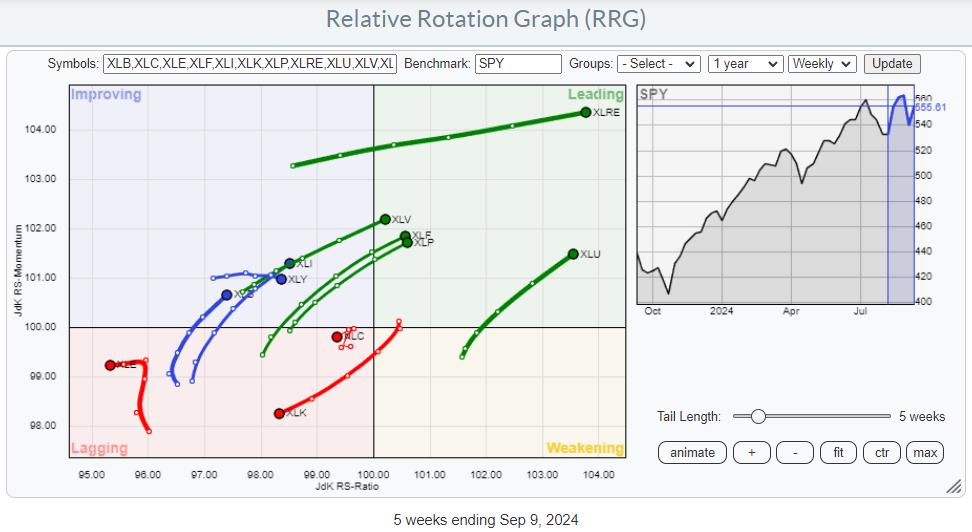
First of all, I apologize for my absence this week. I caught something that looked like Covid, and felt like Covid, but it did not identify (pun intended) as Covid. Apart from feeling lousy, also my voice was gone, so making a video was not a good idea... Read More
RRG Charts September 12, 2024 at 05:29 PM

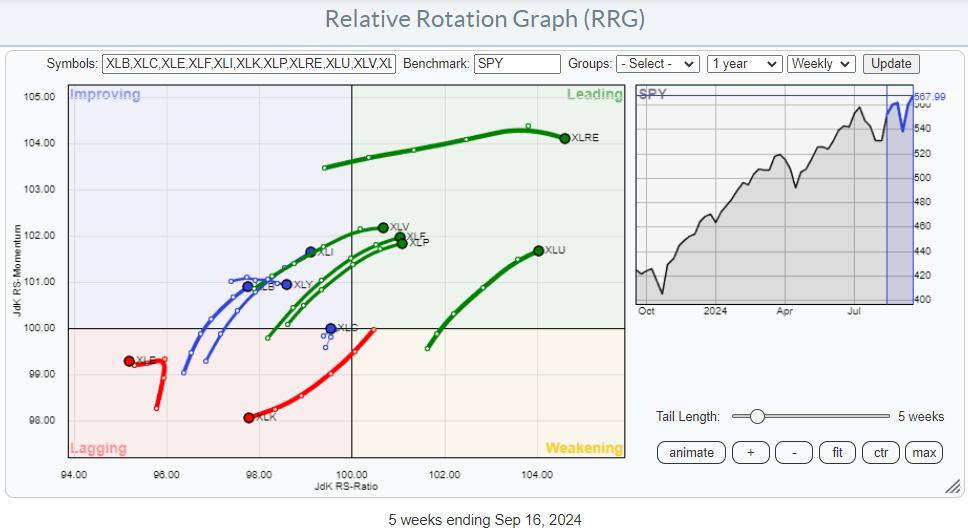
Tech Rallies, But Remains Inside the Lagging Quadrant A quick look at the Relative Rotation Graph for US sectors reveals that the Technology sector is still the main driving force for the market... Read More
RRG Charts September 10, 2024 at 07:35 PM

In this video from StockCharts TV, Julius takes a look at rotations in an asset allocation RRG. He compares fixed-income-related asset classes, commodities, the US dollar, Bitcoin and stocks to a balanced portfolio of 60% stocks/40% bonds... Read More
RRG Charts September 03, 2024 at 04:49 PM

In this video from StockCharts TV, Julius evaluates the completed monthly charts for August, noting the strength of defensive sectors. He then analyzes a monthly RRG and seeks alignment for the observations from the price charts... Read More