RRG Charts September 29, 2020 at 01:16 PM

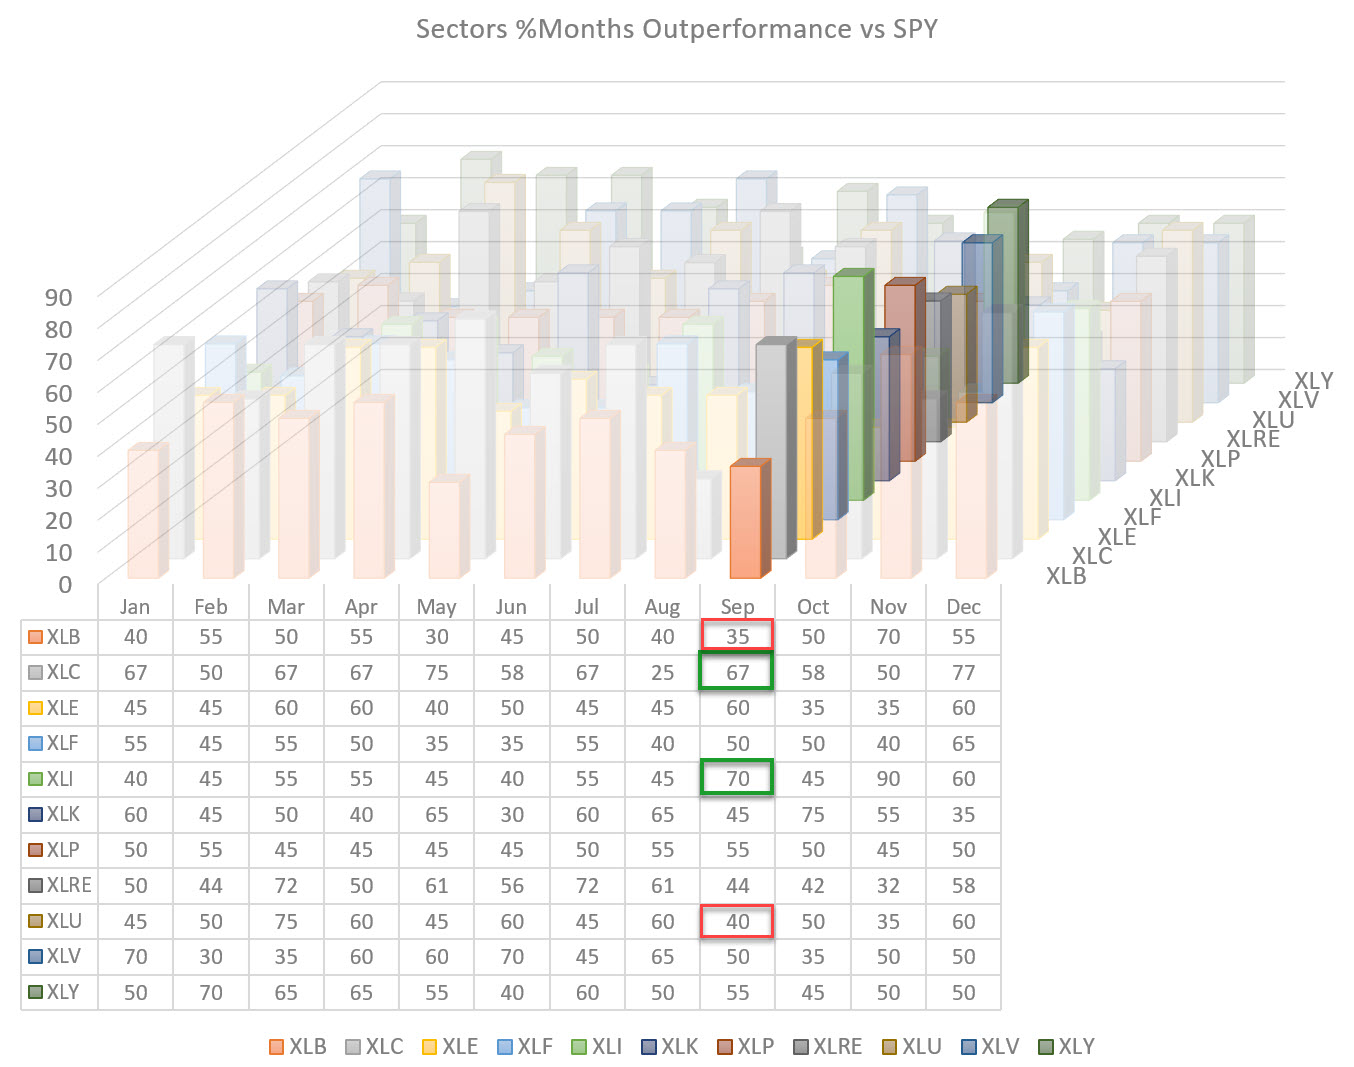
In this edition of Sector Spotlight, with September drawing to an end, I dive into the monthly seasonality, finding some very interesting seasonal patterns for Technology and Communication Services on the one hand and Energy and Health Care on the other... Read More
RRG Charts September 28, 2020 at 04:13 PM

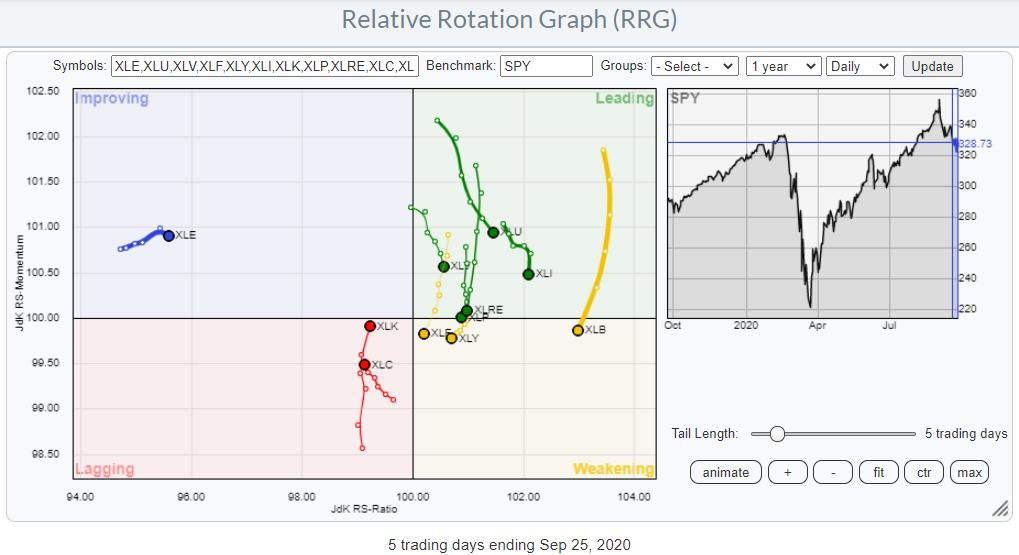
The erratic rotations that we discussed last week are still ongoing. Looking back at the rotational action on the RRG for US sectors last week shows that the focus of investors is shifting back to Technology and Communication Services again... Read More
RRG Charts September 22, 2020 at 06:47 PM

In this edition of Sector Spotlight, I spend the show talking about current market rotations... Read More
RRG Charts September 21, 2020 at 12:17 PM

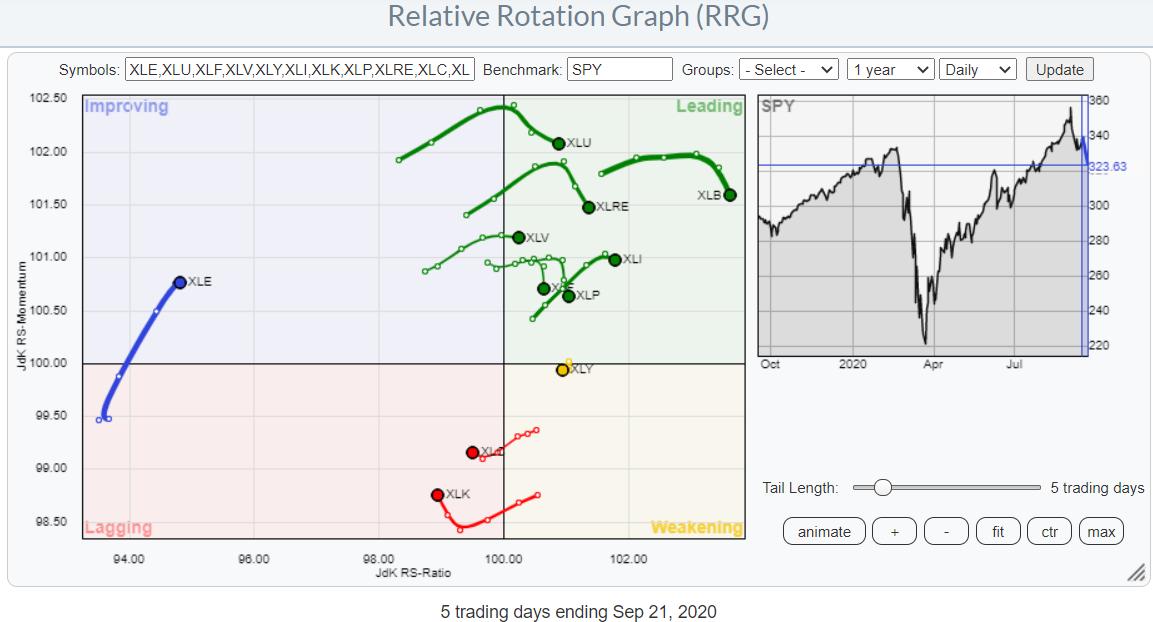
The Relative Rotation Graph above shows the rotation for US sectors on a daily basis at the start of this new week (20.09.21). The most important observation that we can make from this image is that the rotation currently is very erratic... Read More
RRG Charts September 15, 2020 at 08:00 PM

In this edition of Sector Spotlight, I present the usual look at the rotations for Asset Classes and US Sectors via Relative Rotation Graphs. In addition, the better part of the show is spent on answering questions from the mailbag... Read More
RRG Charts September 15, 2020 at 08:52 AM

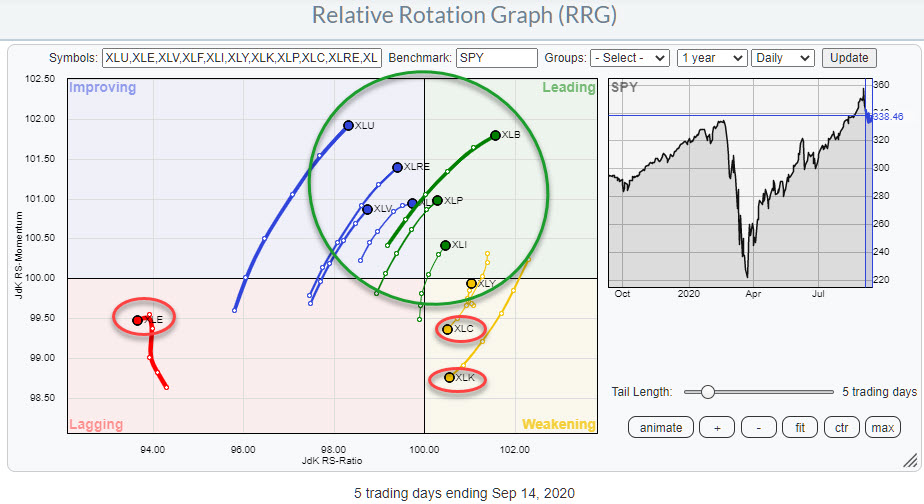
Last week, the rotations for the Communication Services and Technology sectors continued on their trajectory deeper into the weakening quadrant, heading towards lagging... Read More
RRG Charts September 08, 2020 at 02:46 PM

In this edition of Sector Spotlight, I break down the events of last week's volatile price action and how that translates into the tails on the Relative Rotation Graphs; I then put these price moves into a slightly longer-term perspective... Read More
RRG Charts September 01, 2020 at 07:00 PM

In this edition of Sector Spotlight, I look at last week's rotations using daily Relative Rotation Graphs and go over the completed monthly charts for August to catch up on the long-term trends... Read More
RRG Charts September 01, 2020 at 10:23 AM

The graph above shows the percentage of months in which sectors have outperformed the S&P 500 in the past... Read More