The Mindful Investor May 30, 2025 at 07:14 PM
There's no denying that the equity markets have taken on a decisively different look and feel in recent weeks. We've compared the charts of the S&P 500 and Nasdaq 100, as well as leading growth stocks like Nvidia, to an airplane experiencing a "power-on stall"... Read More
The Mindful Investor May 23, 2025 at 05:06 PM
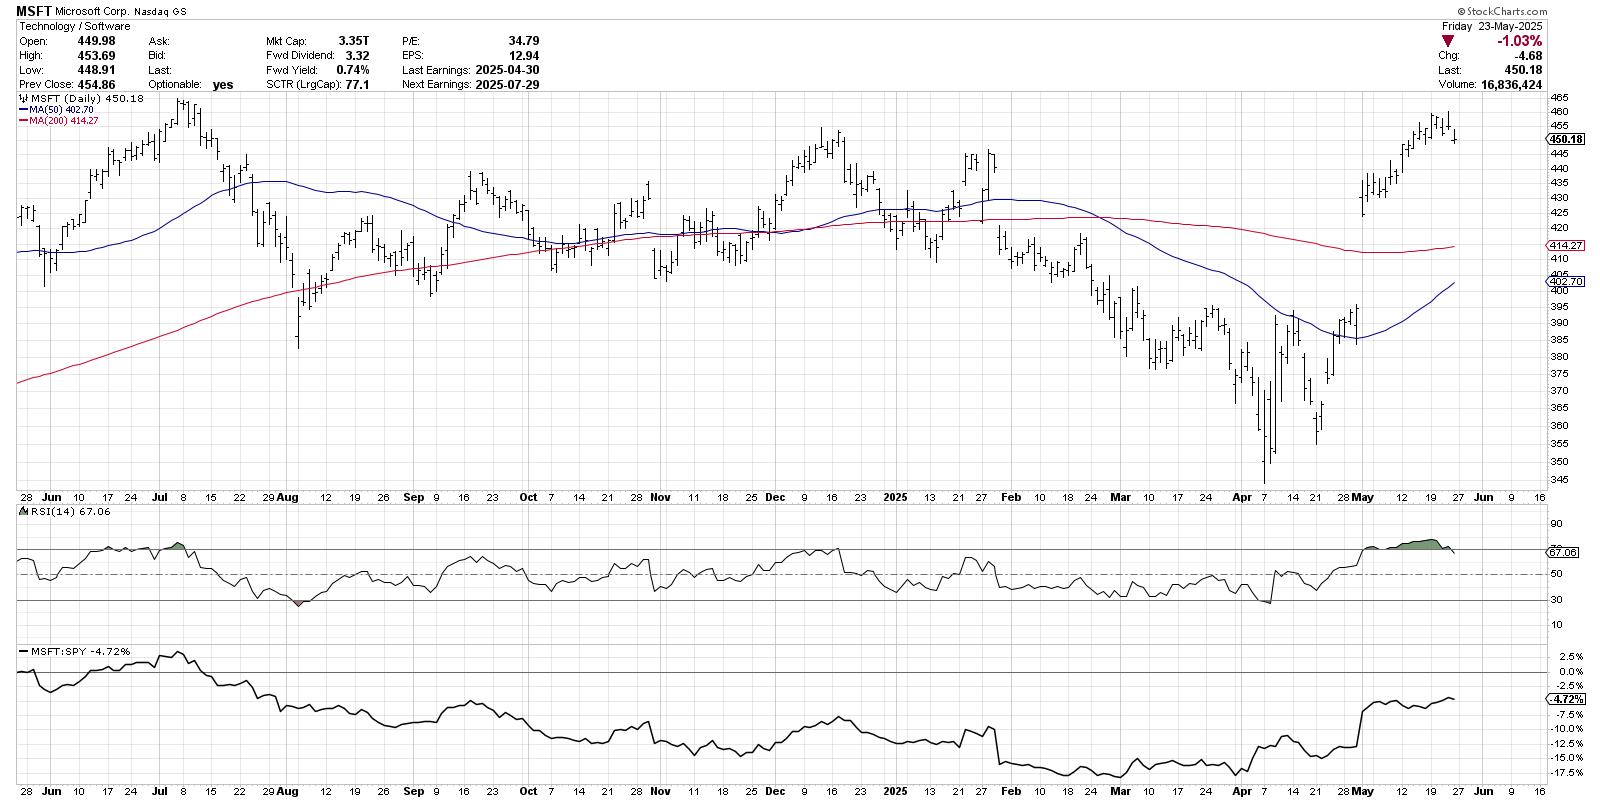
My main question going into this weekend was, "Will the S&P 500 finish the week above its 200-day moving average?" And while the S&P 500 did indeed finish the week above this long-term trend barometer, our main equity benchmark is now within the gap range from earlier this month... Read More
The Mindful Investor May 19, 2025 at 07:43 PM
Learn how to analyze stock price gaps with Dave! In this video, Dave discusses the different types of price gaps, why all price gaps are not the same, and how you can use the StockCharts platform to identify key levels and signals to follow on charts where price gaps occur... Read More
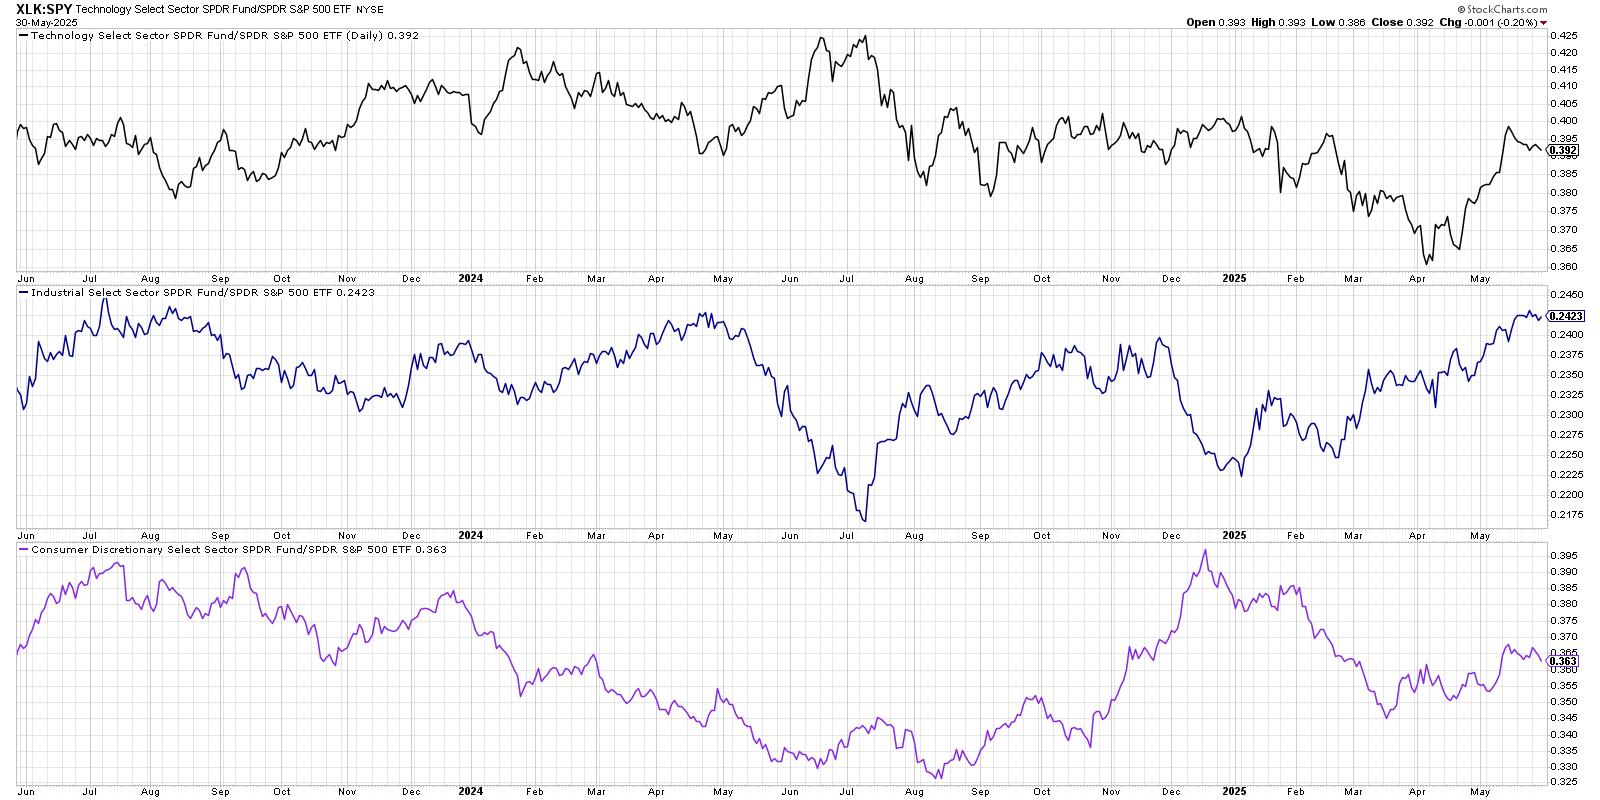
The Mindful Investor May 16, 2025 at 07:49 PM
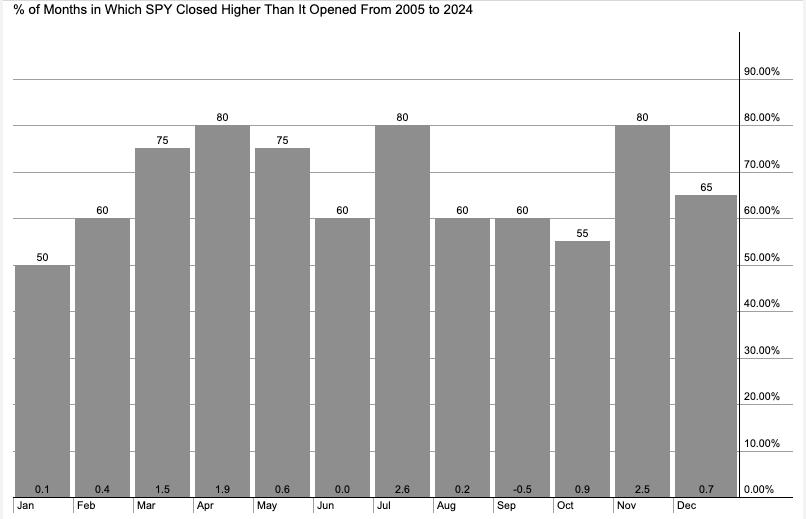
We've all heard the classic market maxim, "Sell in May and go away." For many investors, that's the introduction to market seasonality that suggests a six-month period where it's just best to avoid stocks altogether... Read More
The Mindful Investor May 13, 2025 at 04:38 PM
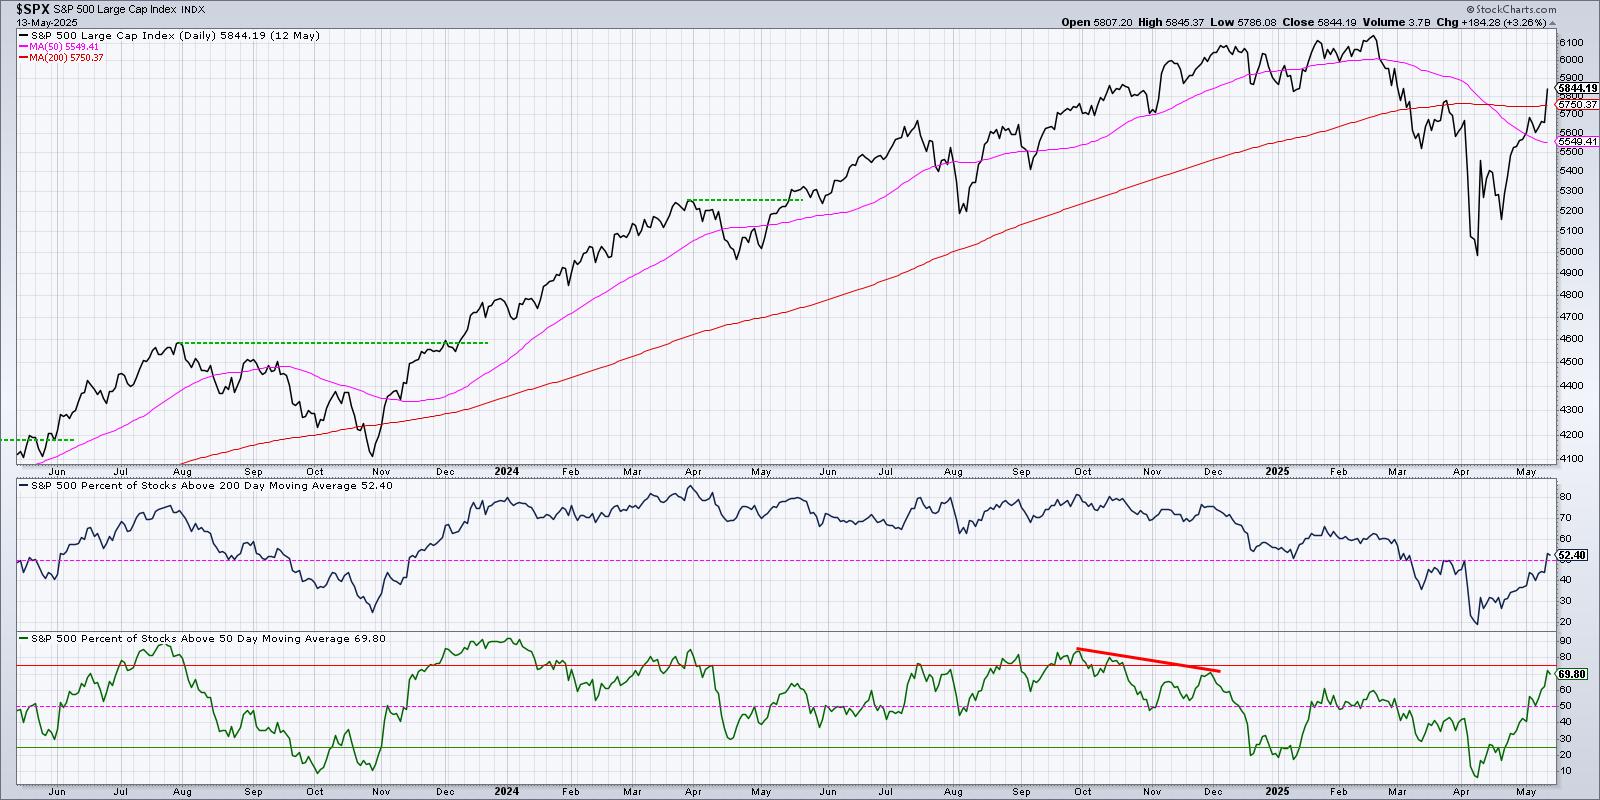
We've been cautious about the uptrend phase off the April low for a number of reasons, including the lack of breadth support. While short-term measures of breadth had turned more positive, the long-term breadth conditions had remained firmly in the bearish realm... Read More
The Mindful Investor May 13, 2025 at 02:11 PM
Bullish signal alert! Over 50% of S&P 500 stocks are now above their 200-day moving average. In this video, Dave explains this key market breadth indicator and what it means for stock market trends... Read More
The Mindful Investor May 09, 2025 at 06:31 PM
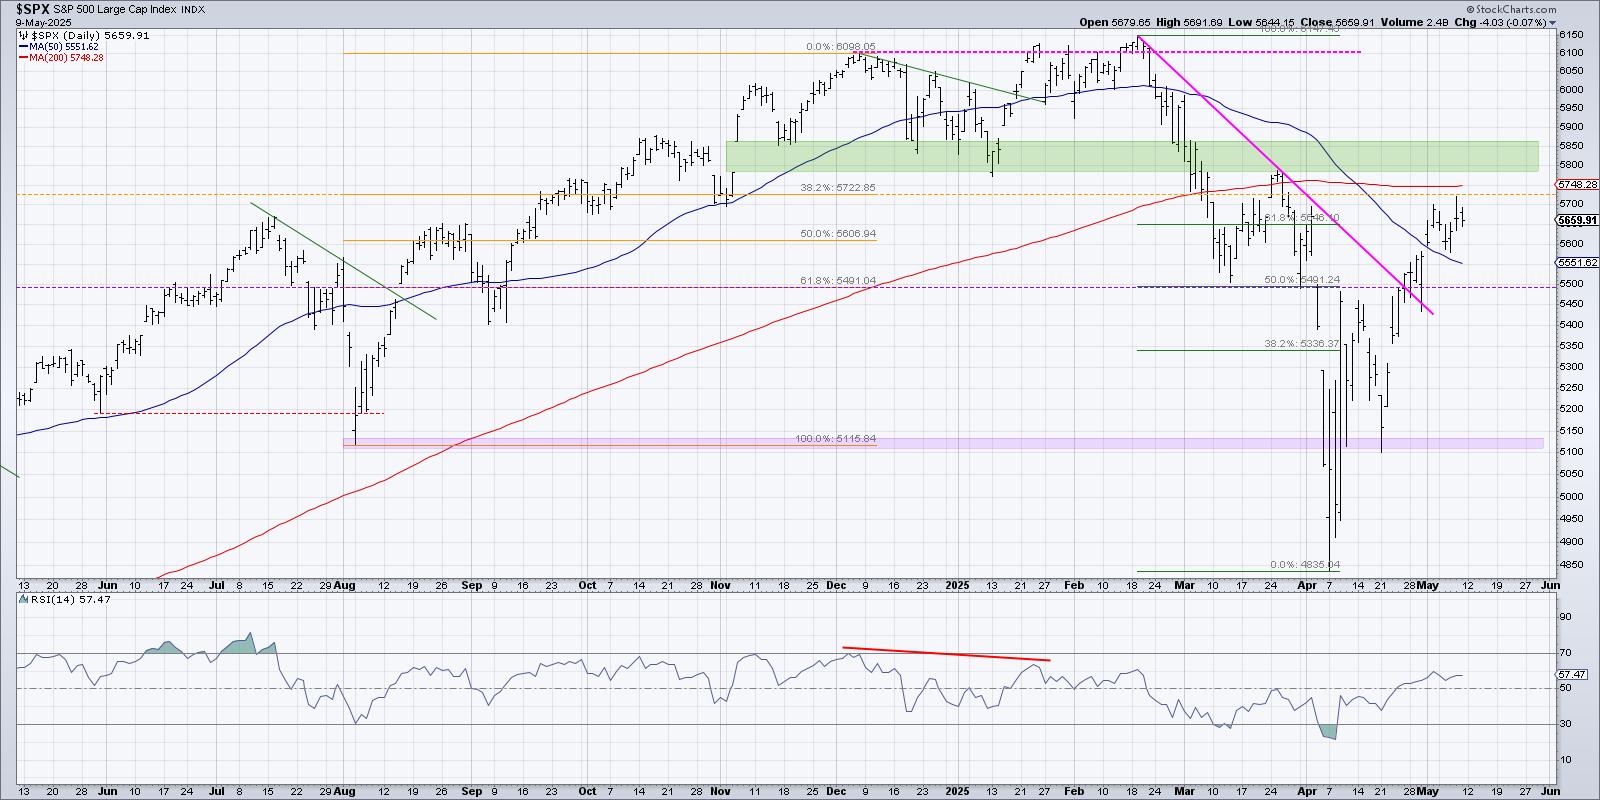
Last Friday, the S&P 500 finished the week just below 5700... Read More
The Mindful Investor May 07, 2025 at 01:28 PM
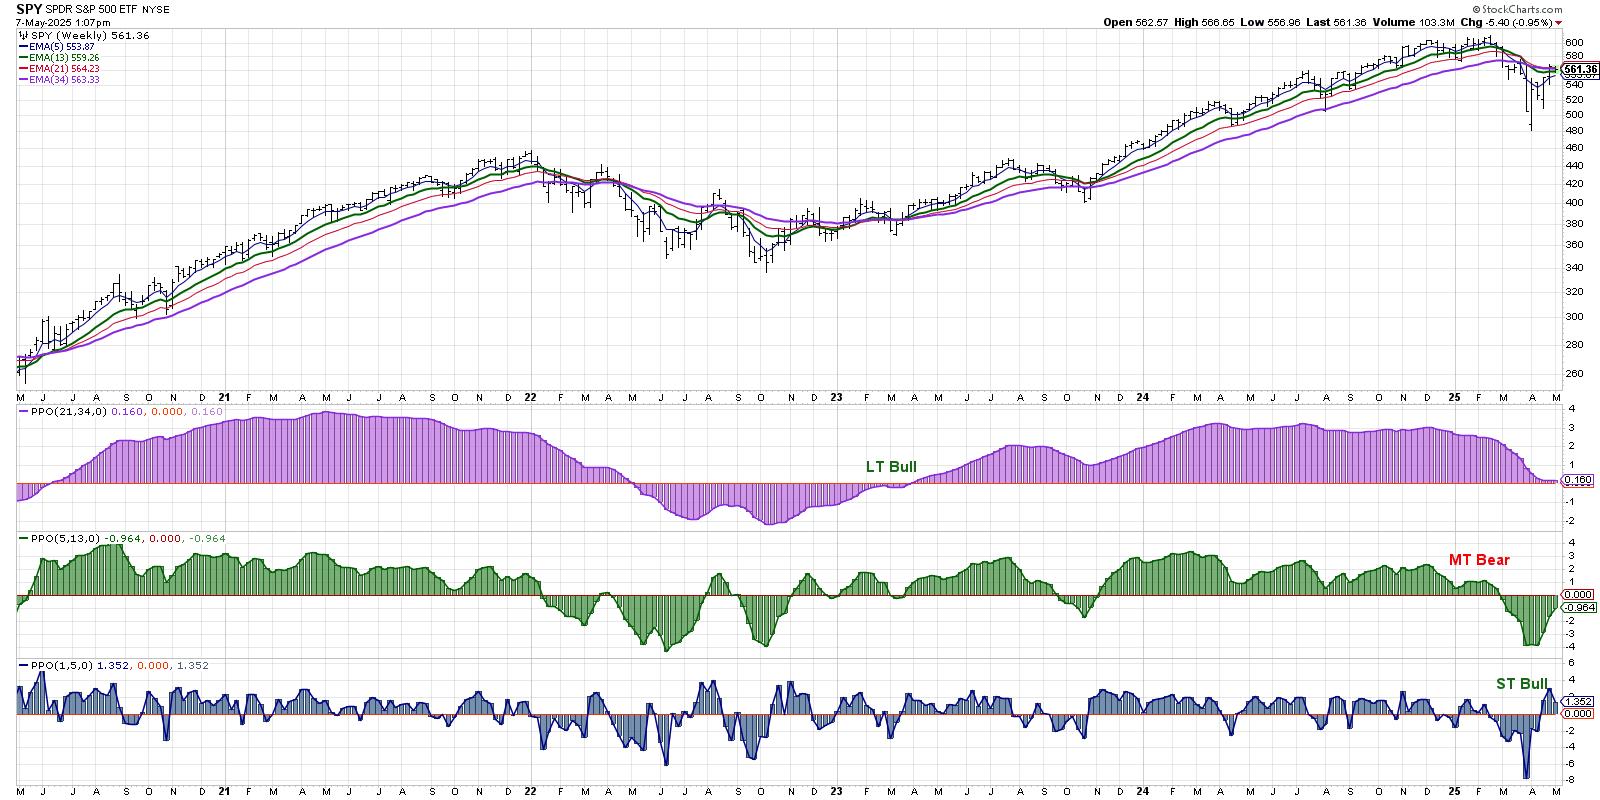
With all eyes and ears on this week's Fed meeting, it's worth taking a big step back to reflect on conditions related to momentum, breadth, and leadership... Read More
The Mindful Investor May 05, 2025 at 11:34 PM
In this video, Dave reveals four key charts he's watching to determine whether the S&P 500 and Nasdaq 100 will be able to power through their 200-day moving averages en route to higher highs... Read More
The Mindful Investor May 02, 2025 at 06:41 PM
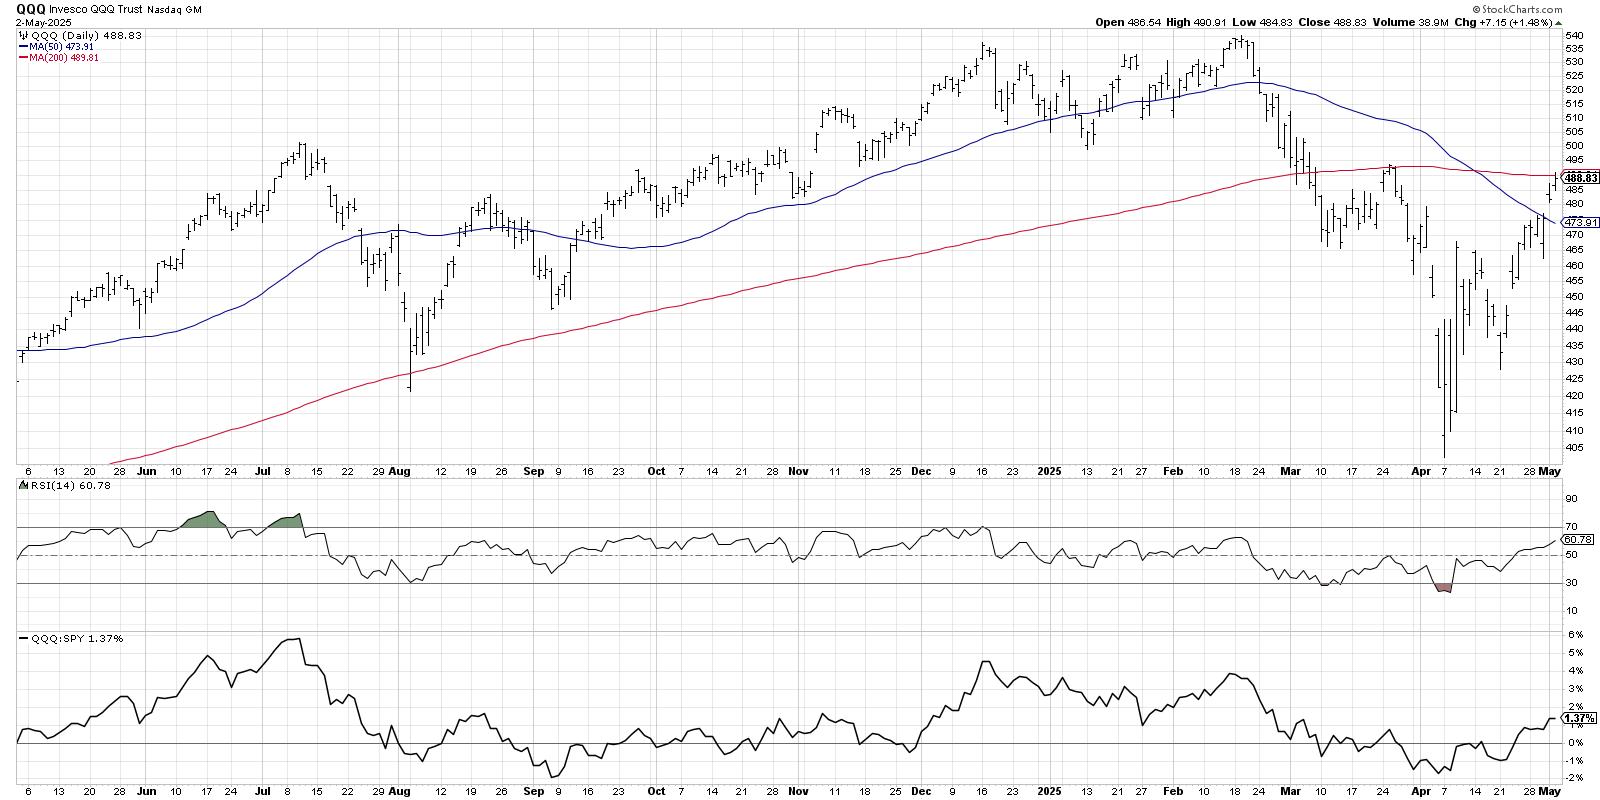
With the major averages logging a strong up week across the board, and with the Nasdaq 100 finally retesting its 200-day moving average from below, it can feel like a challenging time to take a shot at winning charts... Read More