The Mindful Investor November 27, 2024 at 05:31 PM
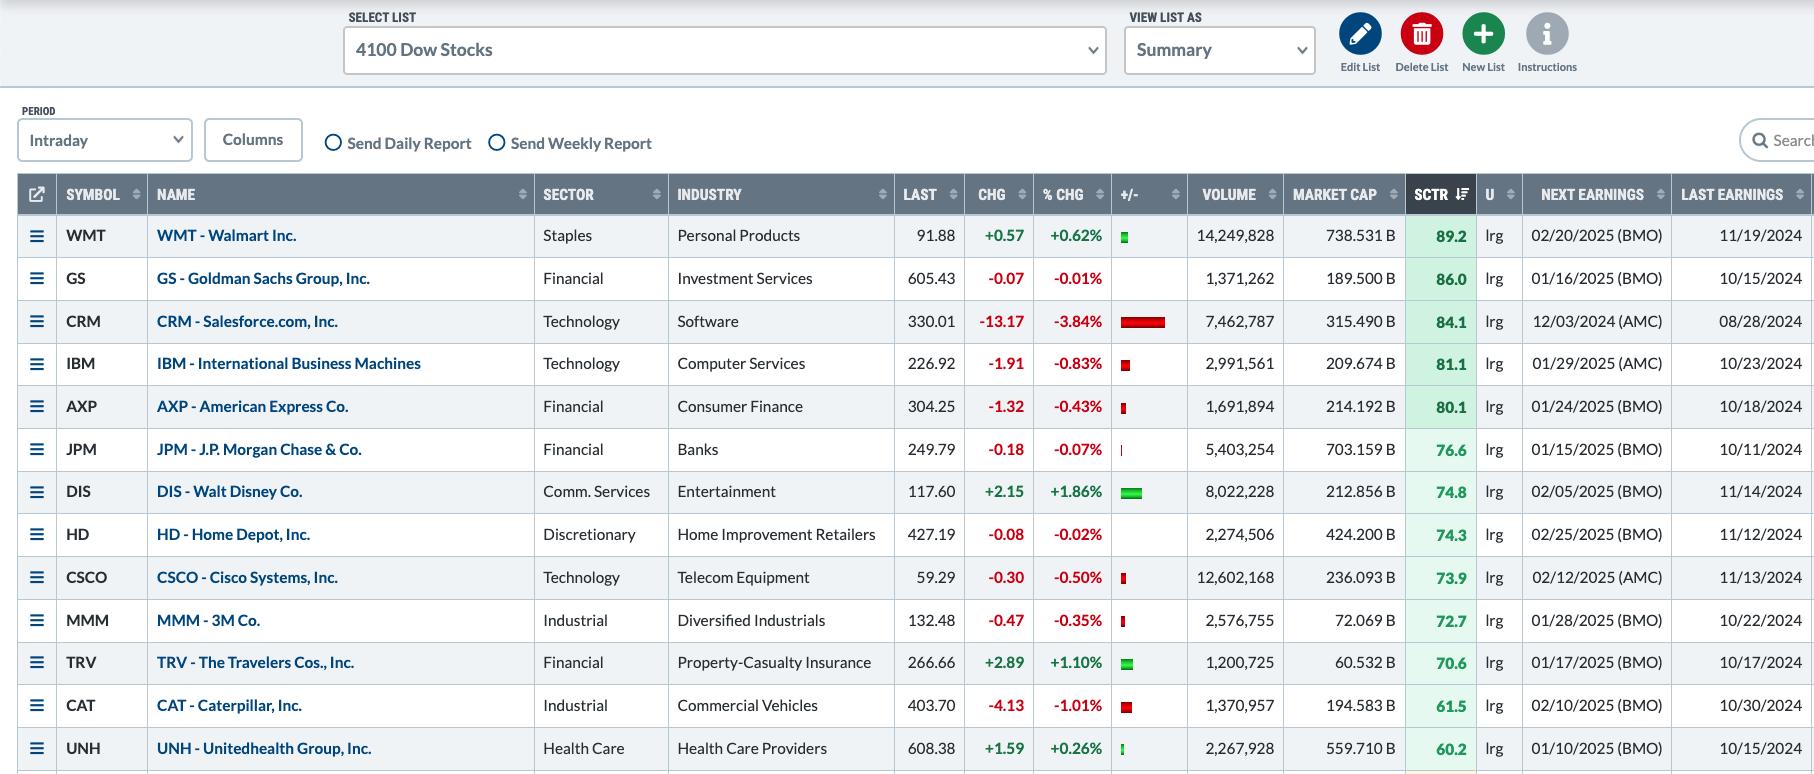
Having used many technical analysis platforms over my career as a technical analyst, I can tell you with a clear conscience that the ChartList feature on StockCharts provides exceptional capabilities to help you identify investment opportunities and manage risk in your portfolio... Read More
The Mindful Investor November 25, 2024 at 10:47 PM
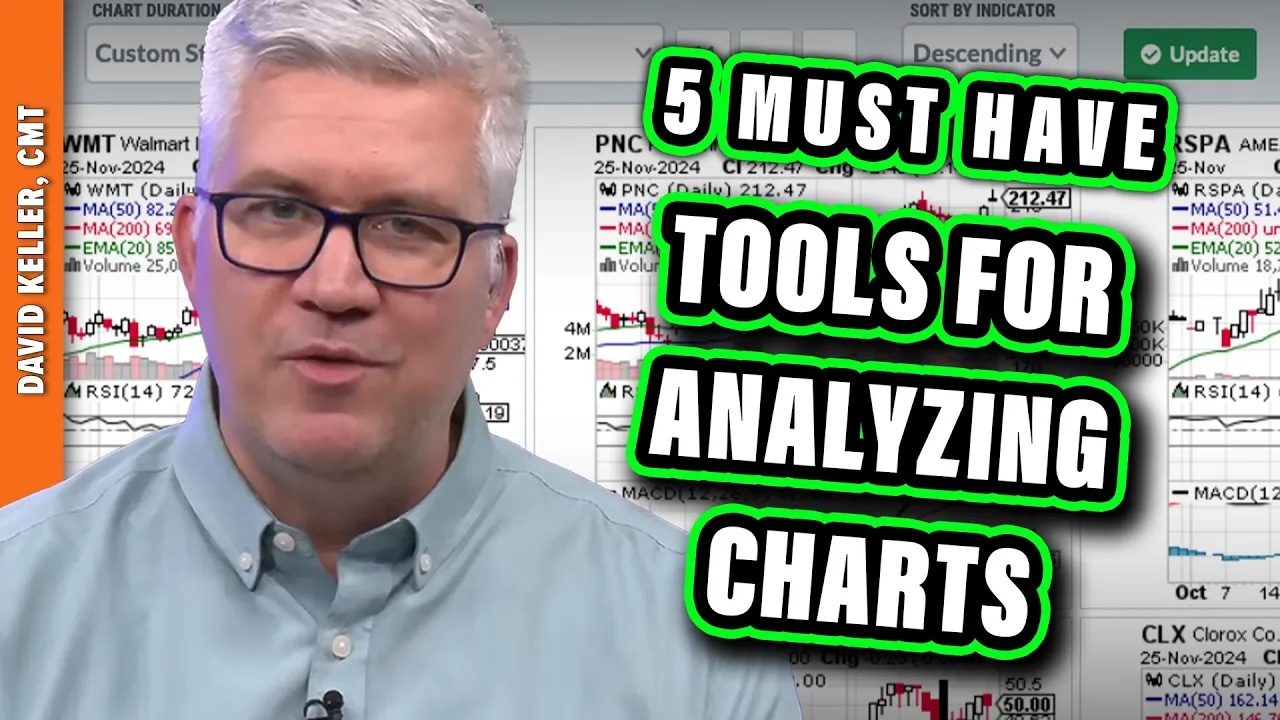
In this video, Dave shares how he uses the powerful ChartLists feature on StockCharts to analyze trends and momentum shifts as part of his daily, weekly, and monthly chart routines... Read More
The Mindful Investor November 22, 2024 at 06:01 PM
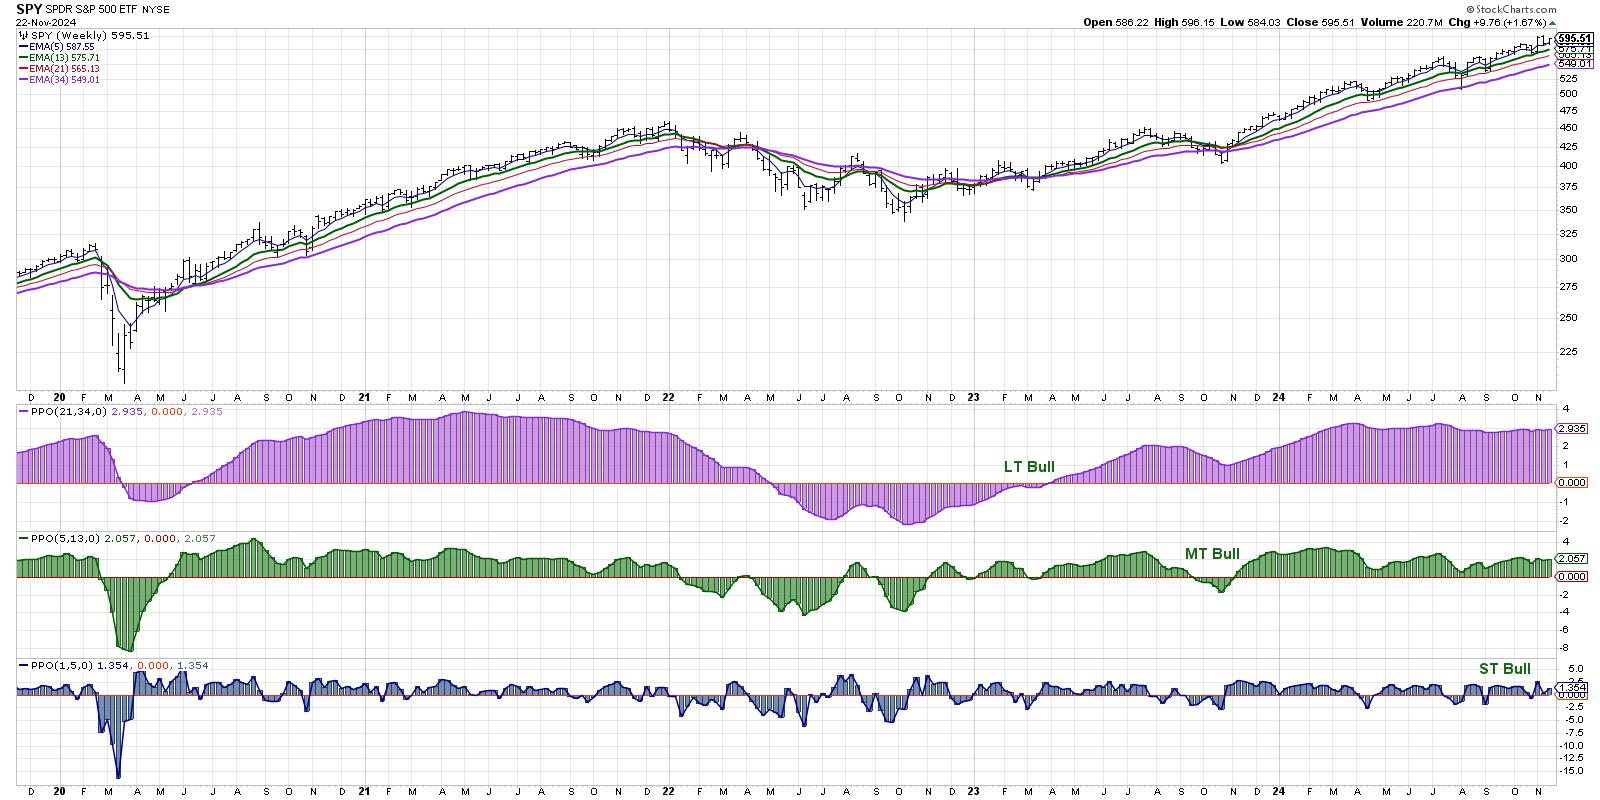
I've always found technical analysis to be a fantastic history lesson for the markets. If you want to consider how the current conditions relate to previous market cycles, just compare the charts; you'll usually have a pretty good starting point for the discussion... Read More
The Mindful Investor November 20, 2024 at 11:27 AM
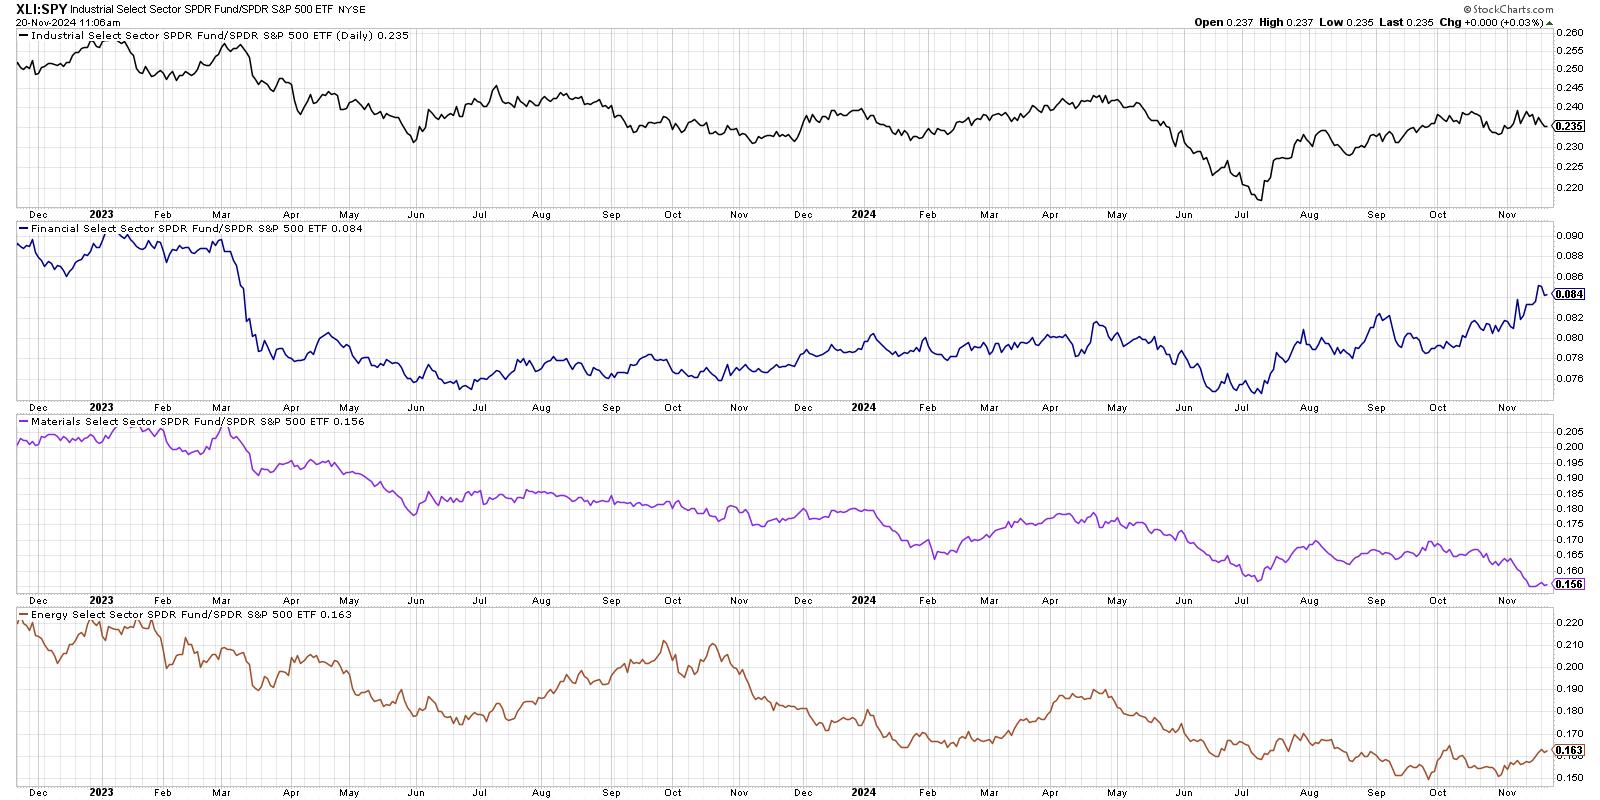
Institutional investors tend to focus heavily on relative strength; after all, this is essentially how they are evaluated in their performance as money managers! In this article, let's review three ways to analyze relative strength and what these charts are telling us about secto... Read More
The Mindful Investor November 19, 2024 at 05:46 PM

In this video, Dave outlines three tools he uses on the StockCharts platform to analyze sector rotation, from sector relative strength ratios to the powerful Relative Rotation Graphs (RRG)... Read More
The Mindful Investor November 15, 2024 at 05:32 PM
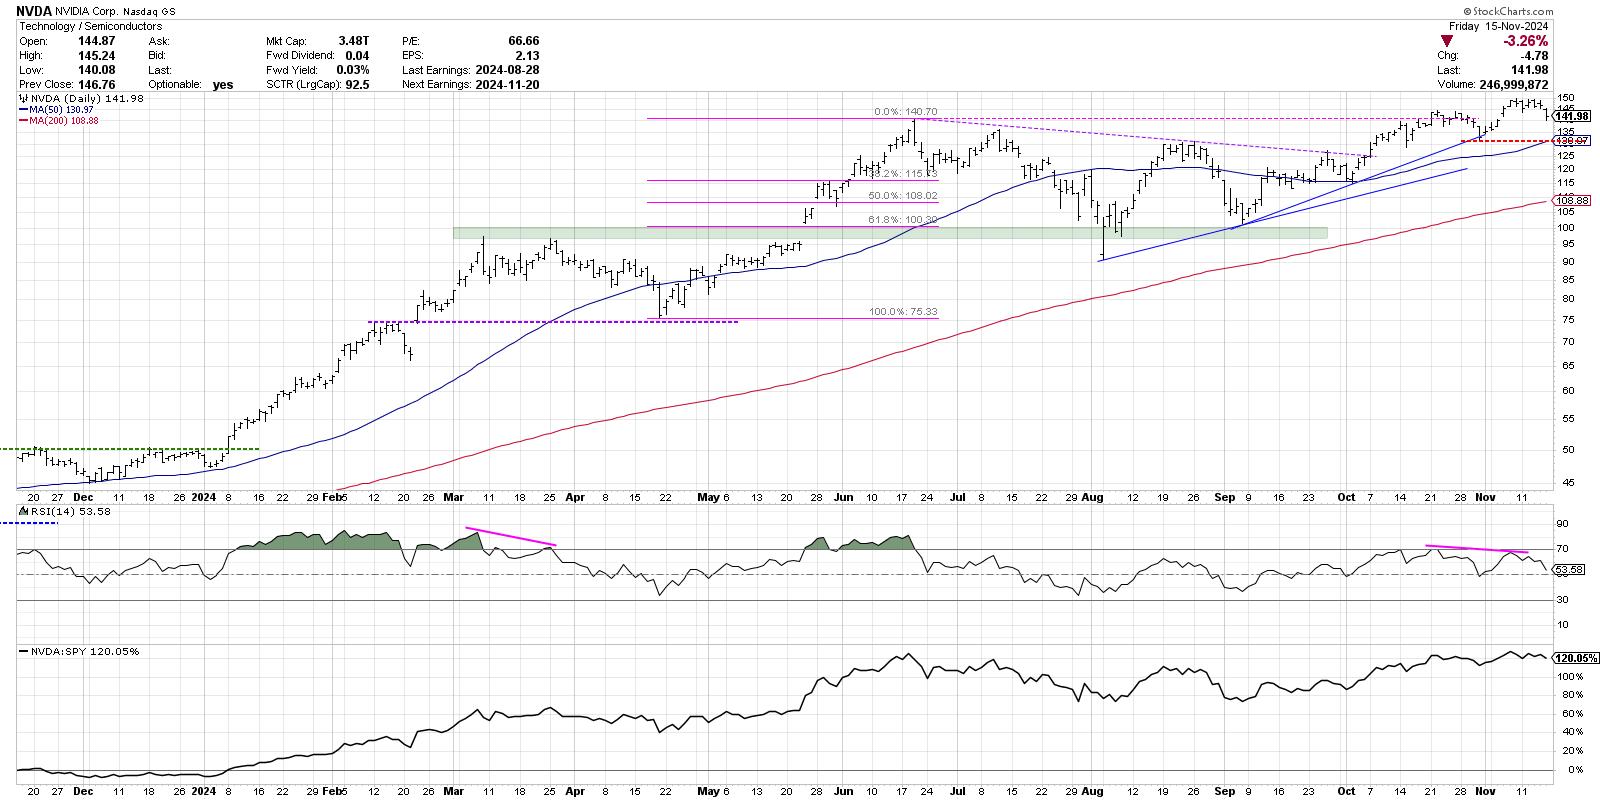
There's no denying the strength that the mega-cap growth names have exerted on the equity markets in 2024... Read More
The Mindful Investor November 14, 2024 at 02:53 PM
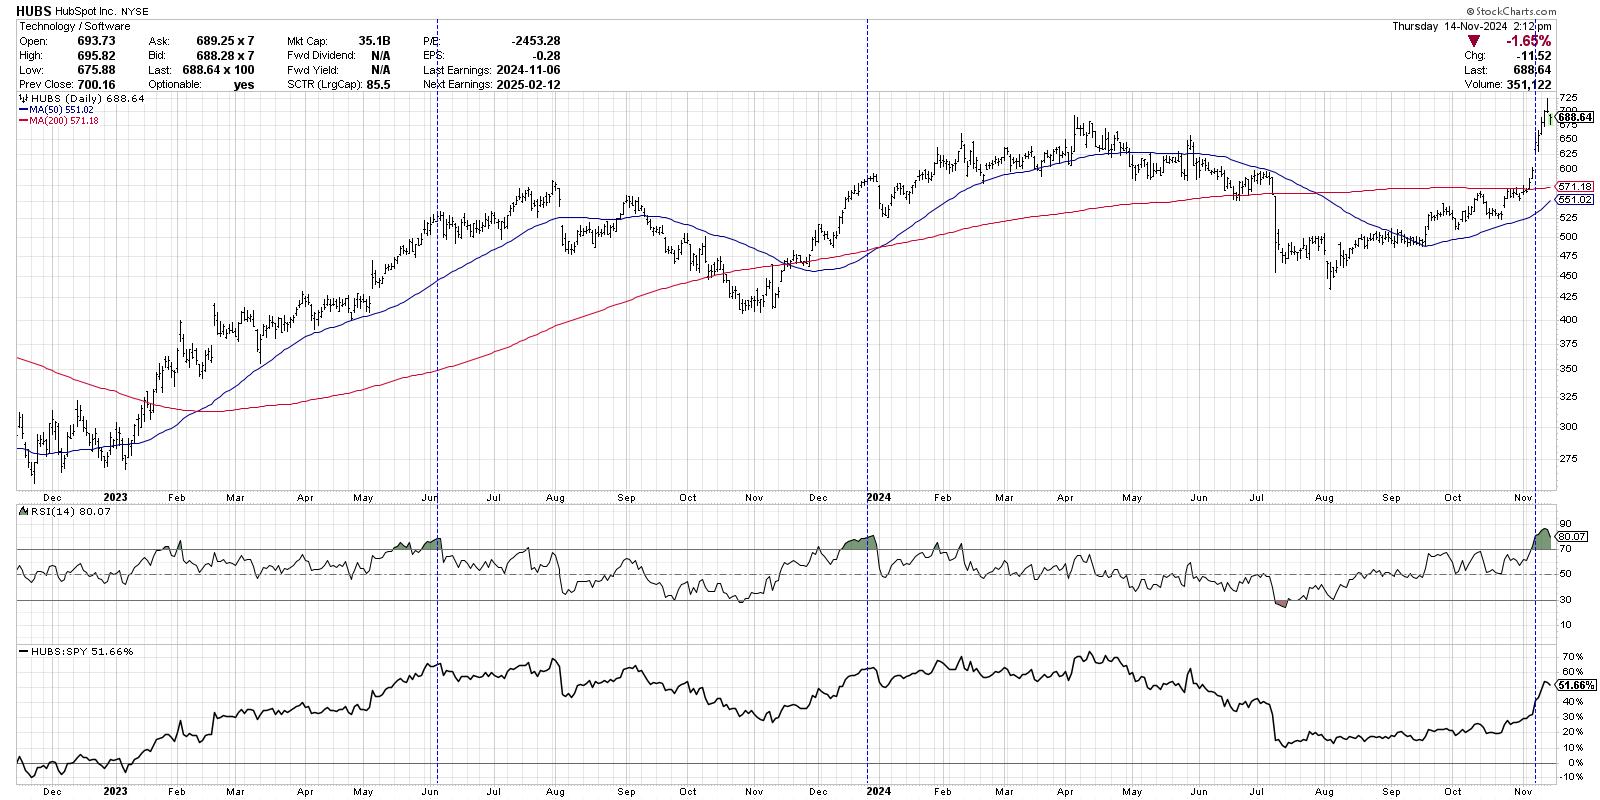
I was originally taught to use RSI as a swing trading tool, helping me to identify when the price of a particular asset was overextended to the upside and downside... Read More
The Mindful Investor November 13, 2024 at 01:06 PM
When a stock shows an RSI value above 80, is that a good thing or a bad thing? In this video, Dave reviews a series of examples showing this "extreme overbought" condition, highlights how these signals usually occur not at the end of, but often earlier in an uptrend phase, and un... Read More
The Mindful Investor November 05, 2024 at 06:55 PM
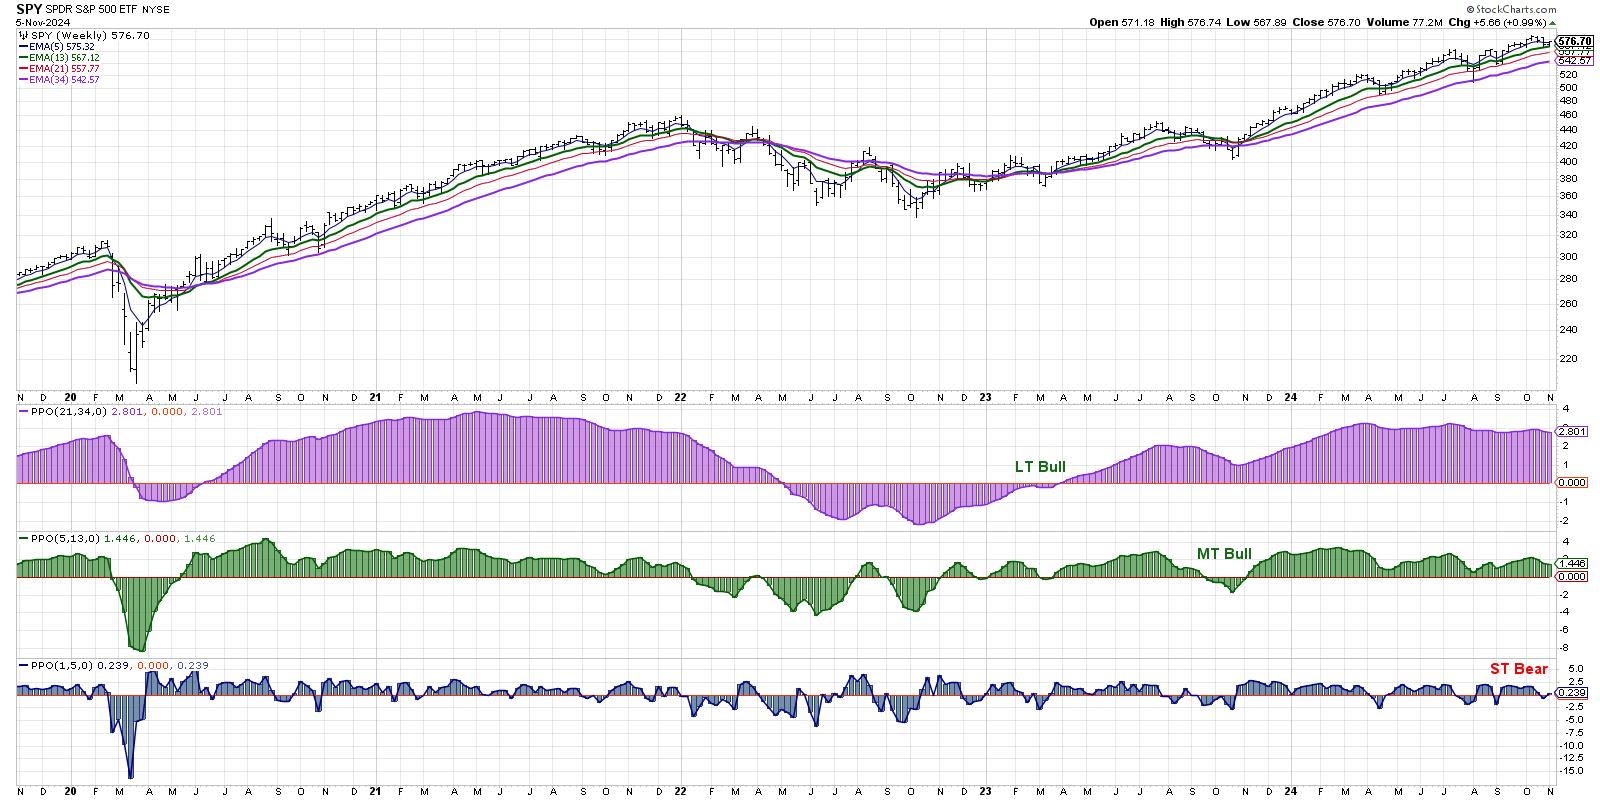
Back in the day, I used to look at the weekly S&P 500 chart every weekend and ask myself the same three questions: What is the long-term trend? What is the medium-term trend? What is the short-term trend? My goal was to make sure that I was respecting the broader market direction... Read More
The Mindful Investor November 04, 2024 at 05:45 PM
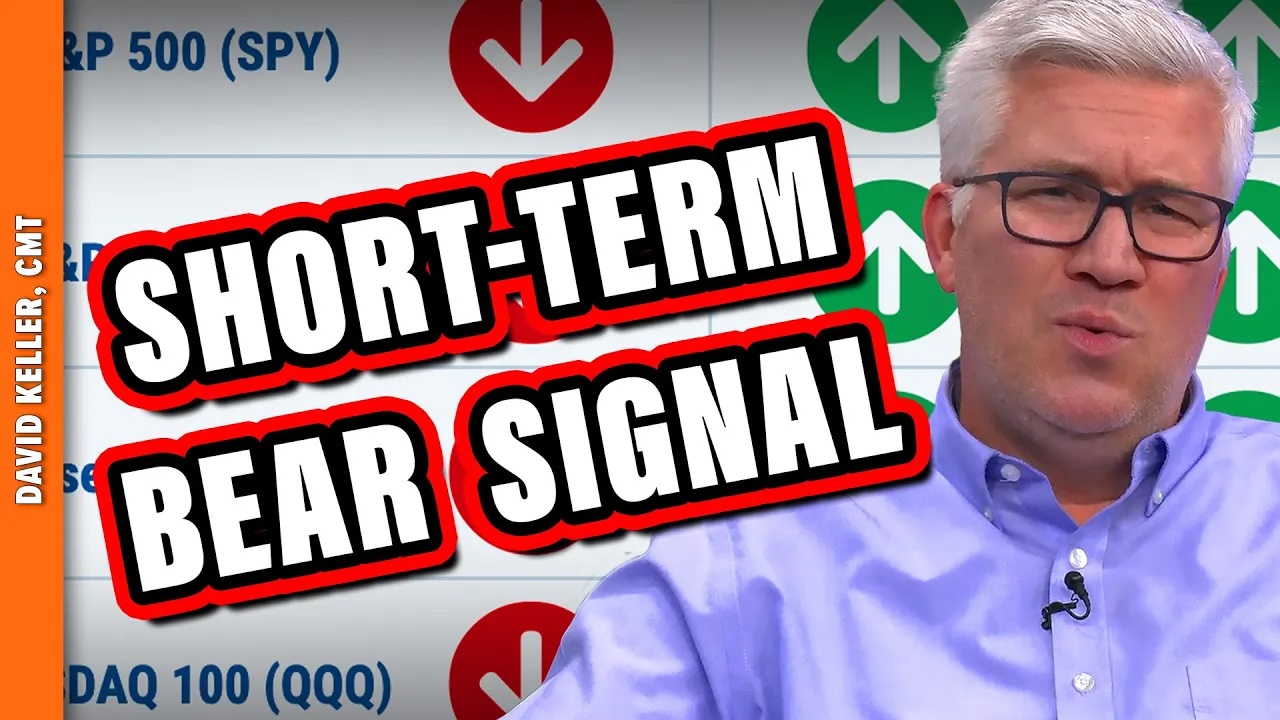
In this video, Dave breaks down the three time frames in his Market Trend Model, reveals the short-term bearish signal that flashed on Friday's close, relates the current configuration to previous bull and bear market cycles, and shares how investors can best track this model to ... Read More
The Mindful Investor November 01, 2024 at 05:47 PM
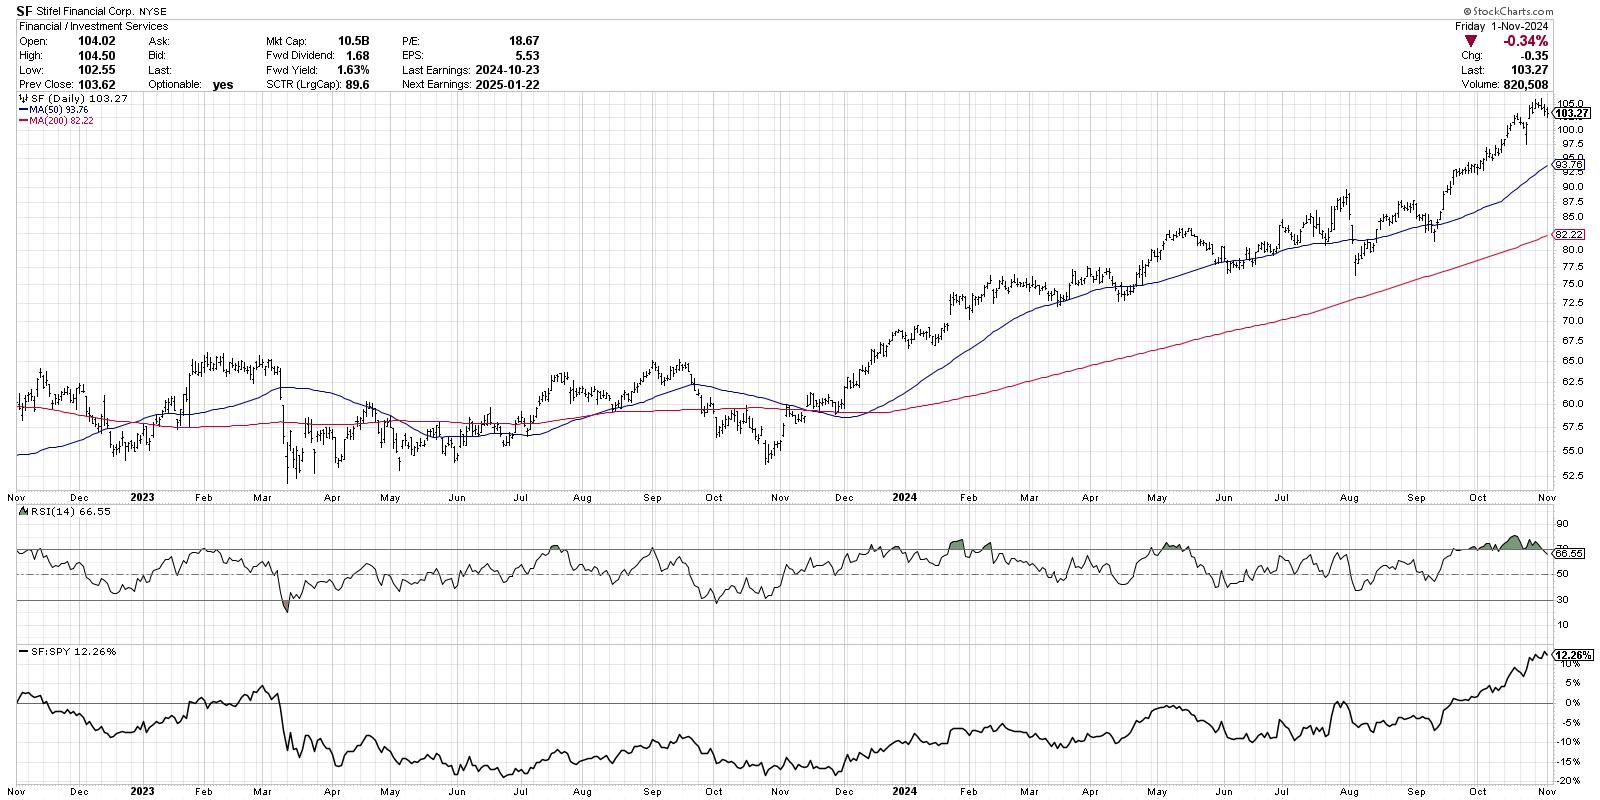
With the Magnificent 7 stocks struggling to hold up through a tumultuous earnings season, what sort of opportunities are emerging on the charts going into November? Today, we'll break down some of the names we've included in our Top Ten Charts to Watch for November 2024... Read More