The Mindful Investor October 30, 2024 at 08:18 PM
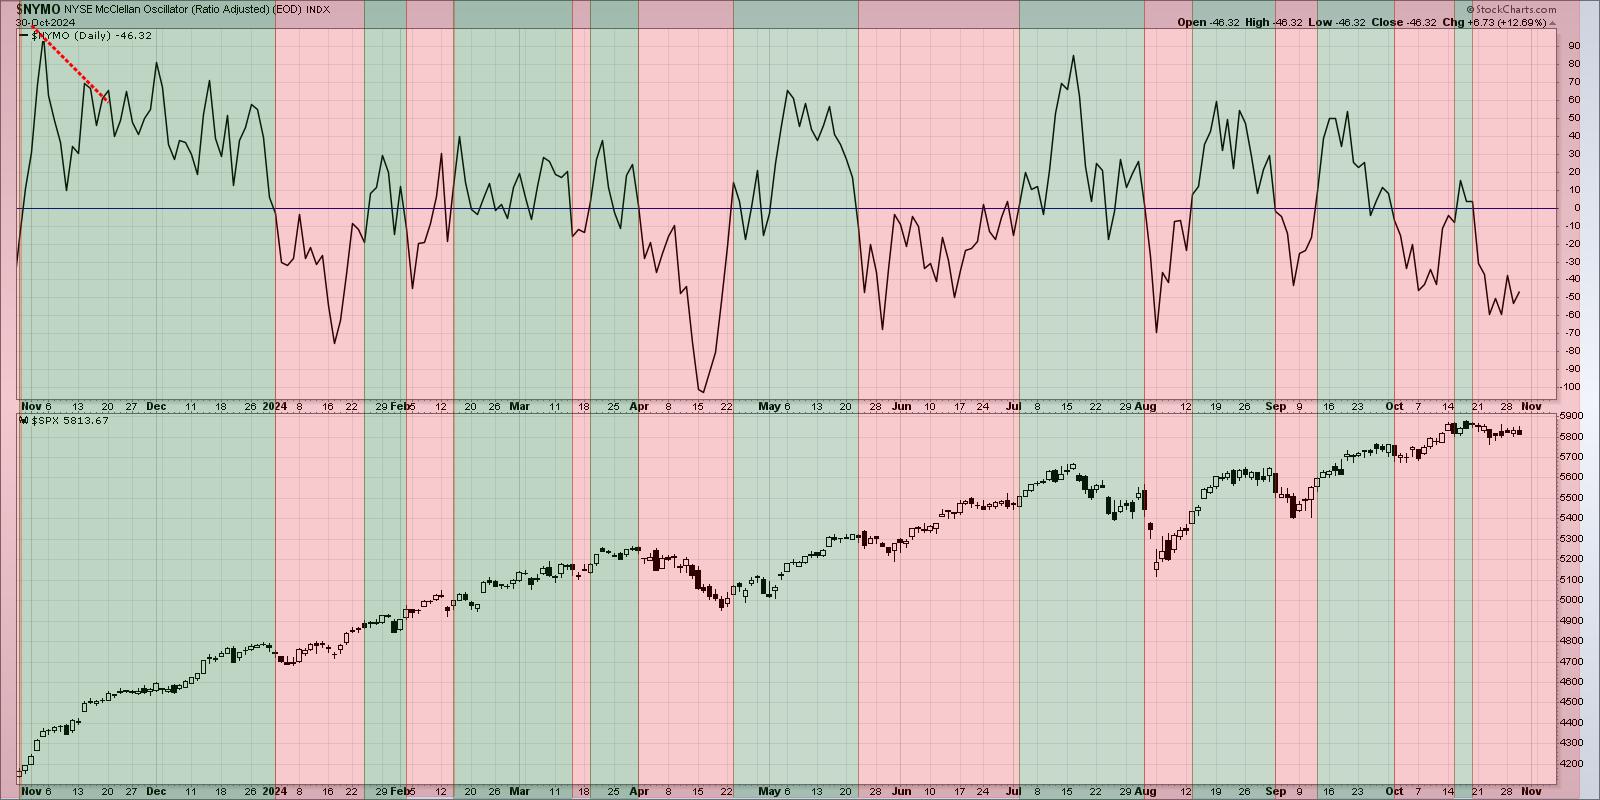
As we near the end of October 2024, it's important to note that the market trends remain quite strong. Despite plenty of short-term breakdowns in key stocks this week, our Market Trend Model remains bullish on all time frames... Read More
The Mindful Investor October 28, 2024 at 05:45 PM
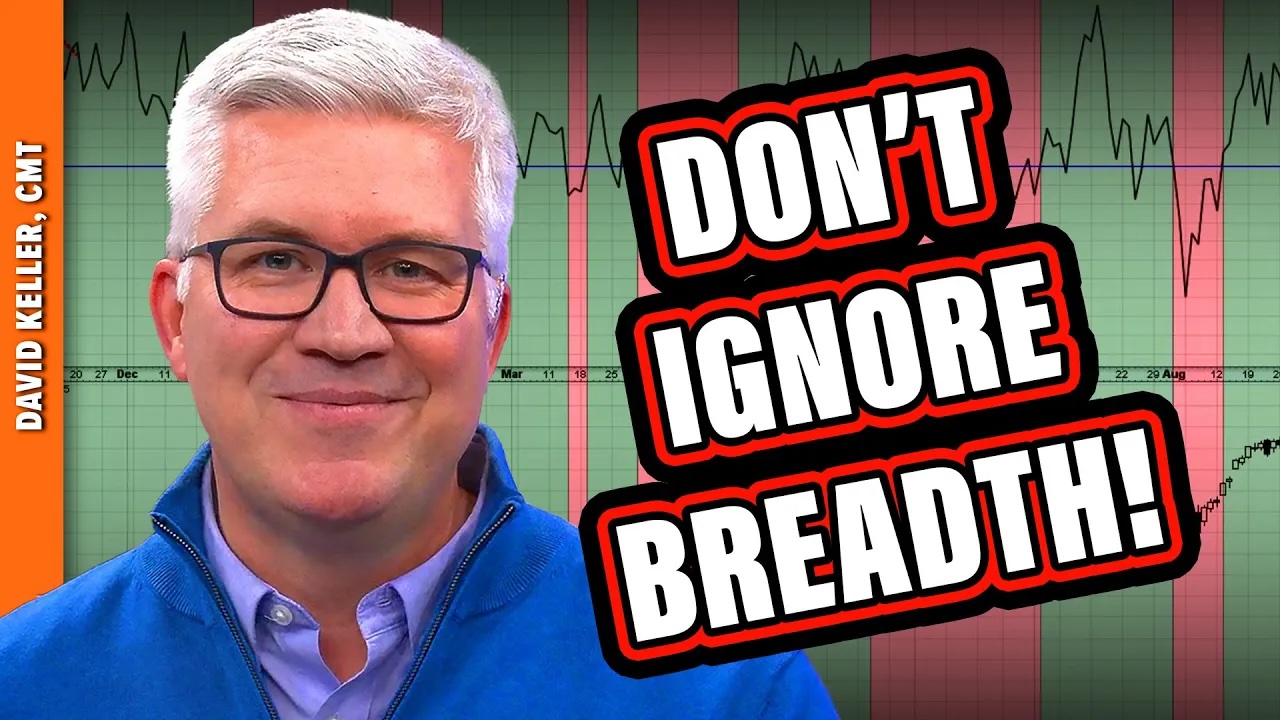
In this video, Dave digs into five market breadth indicators every investor should track as we navigate a volatile period including Q3 earnings, the US elections, and the November Fed meeting... Read More
The Mindful Investor October 25, 2024 at 05:12 PM
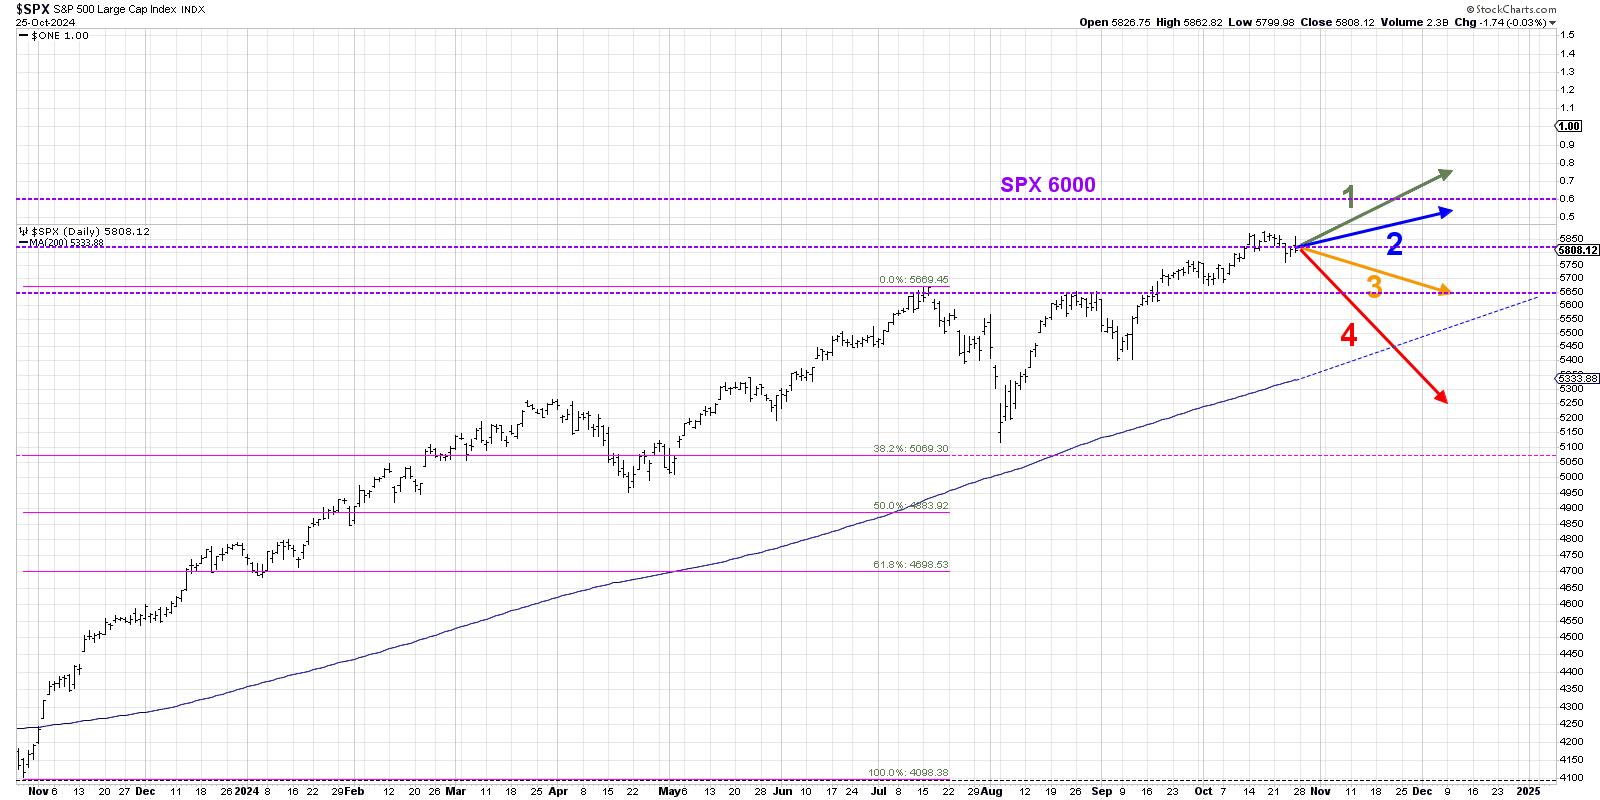
When I was growing up, I loved Choose Your Own Adventure books. I see the world in shades of gray instead of black-and-white, so I was immediately drawn to the seemingly endless scenarios that the main characters could experience as I made different choices for them... Read More
The Mindful Investor October 23, 2024 at 01:46 PM
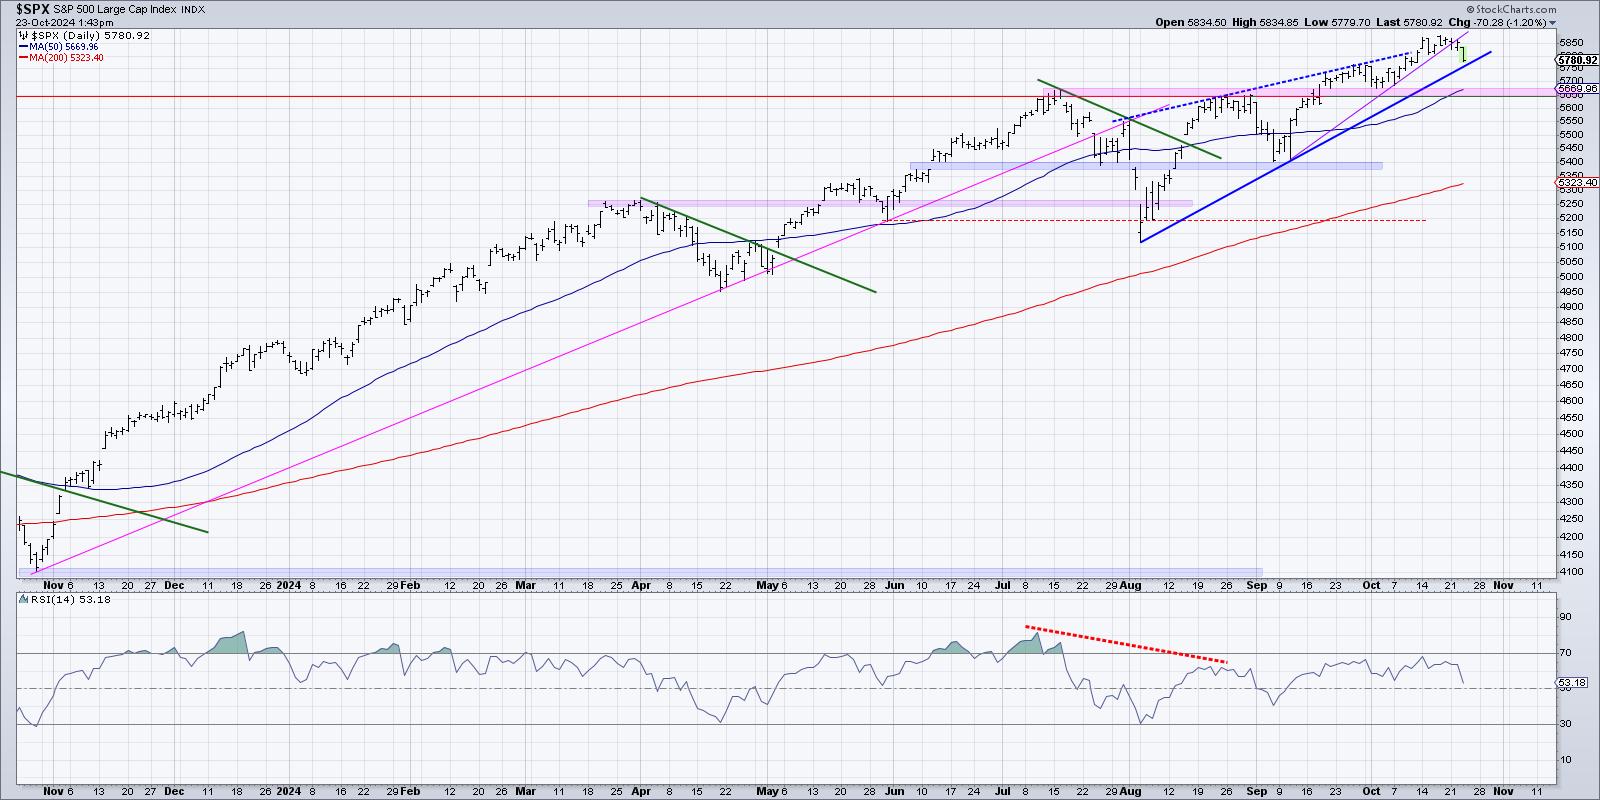
As we get into the meat of Q3 earnings season, I'm seeing a growing and concerning number of signs of distribution in the equity markets... Read More
The Mindful Investor October 21, 2024 at 05:54 PM
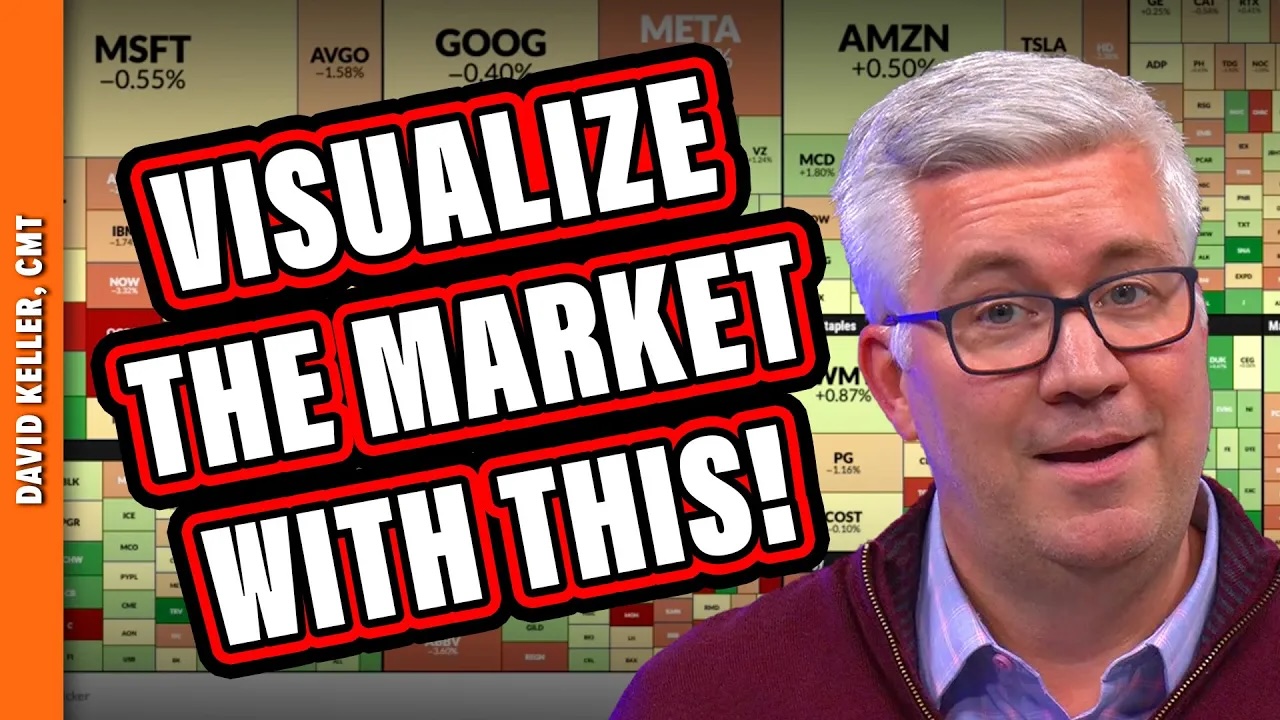
How do you track movements of all the S&P 500 stocks on any given trading day? In this video, Dave will show you how he uses the StockCharts MarketCarpet to evaluate broad equity market conditions, assess the changes in the mega-cap stocks which dominate the benchmarks, and ident... Read More
The Mindful Investor October 18, 2024 at 06:45 PM
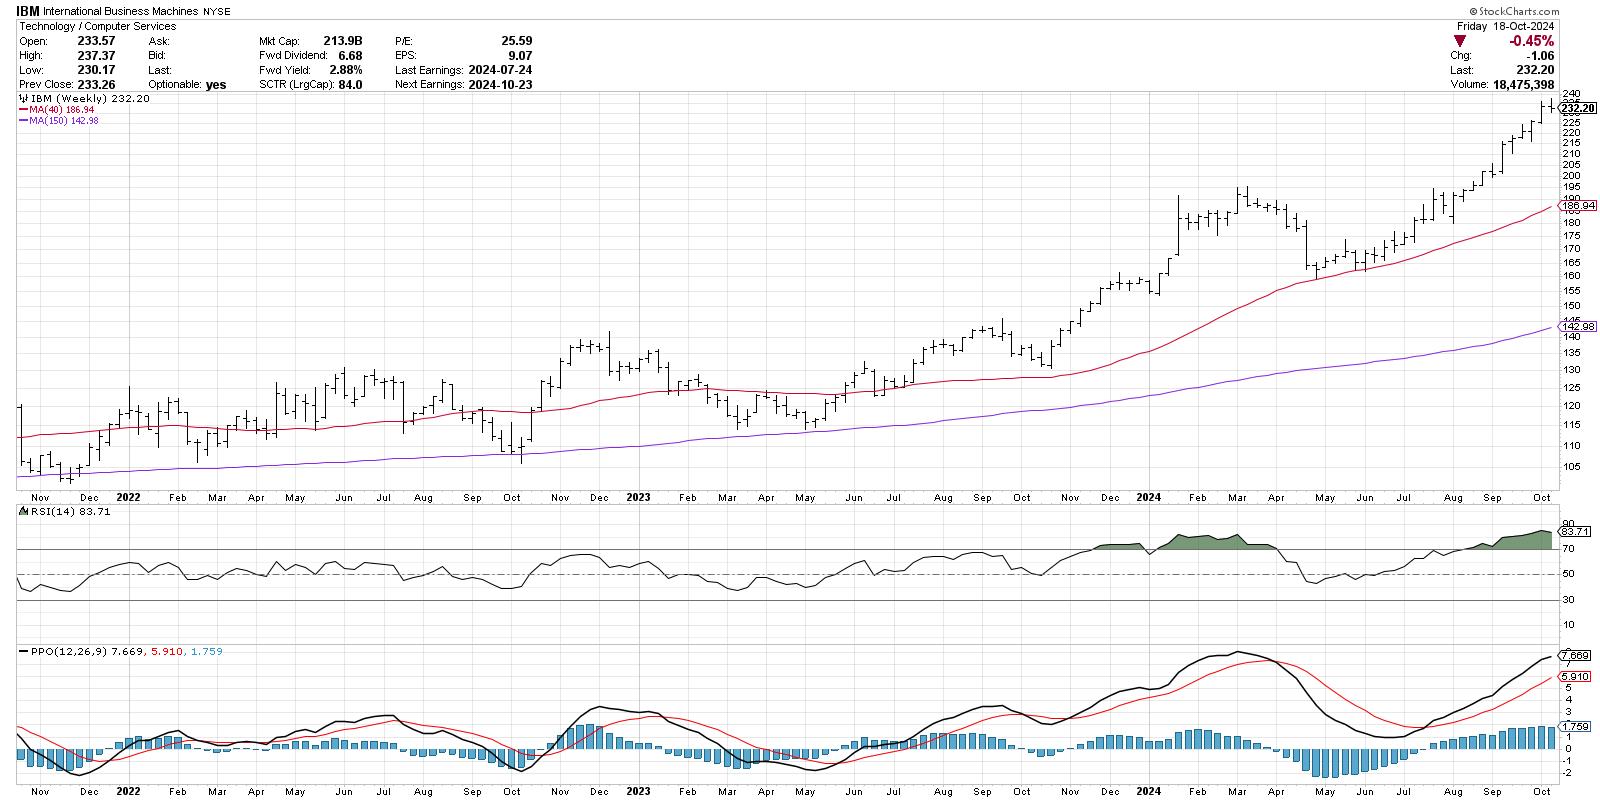
The Moving Average Convergence/Divergence (MACD) indicator, created by technical analyst Gerald Appel, is a technical indicator designed to confirm once a trend change has occurred... Read More
The Mindful Investor October 16, 2024 at 03:26 PM
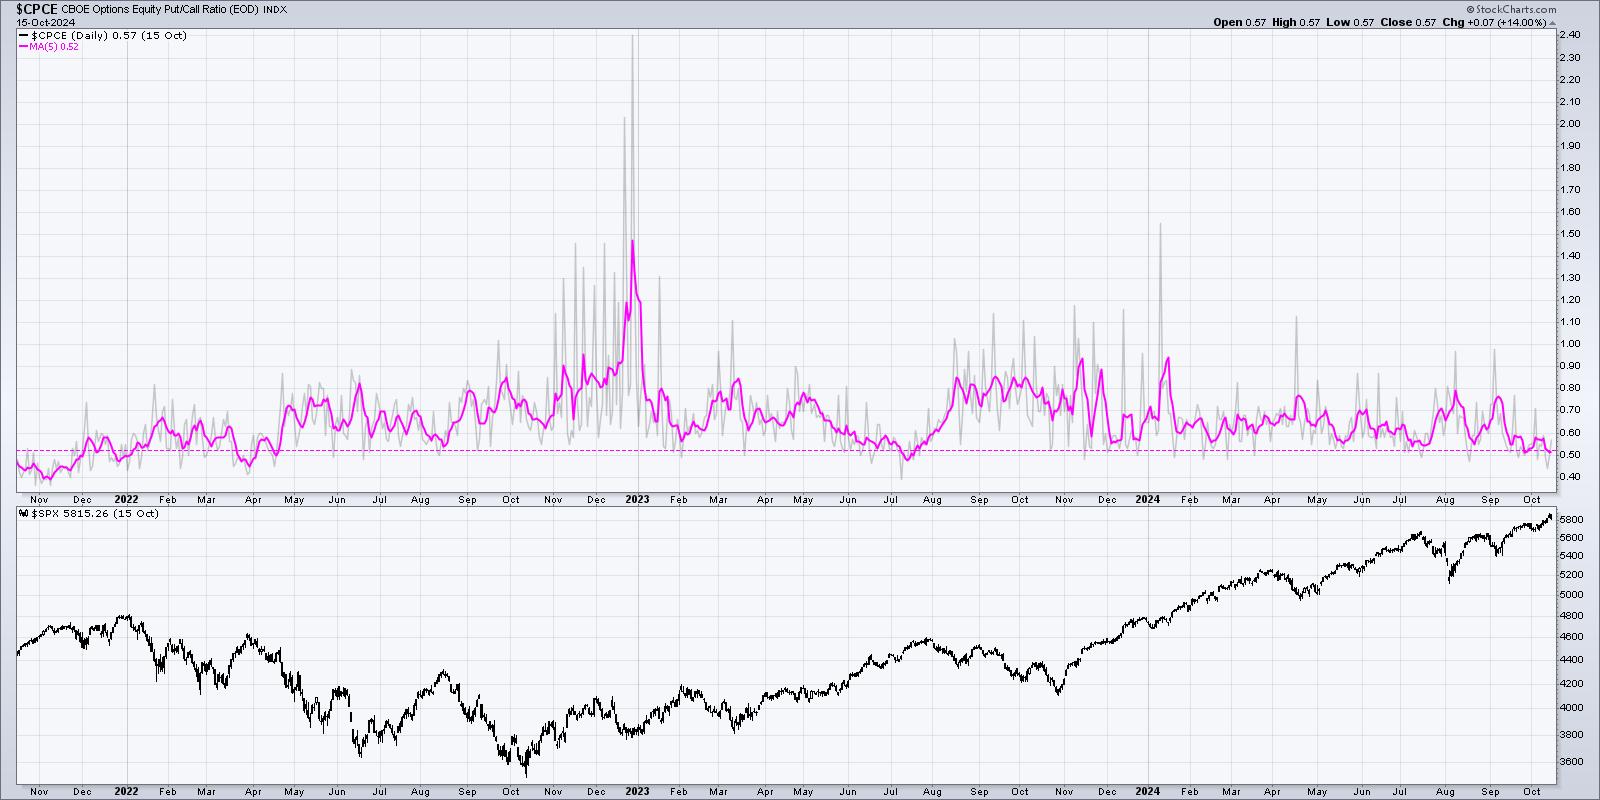
At some point, this raging and relentless bull market has to slow down -- right?!? And yet, as you'll see from a quick review of three key market sentiment indicators, there could still be plenty of room for further upside in risk assets... Read More
The Mindful Investor October 14, 2024 at 06:15 PM
Which market sentiment indicators should we follow to validate the current bull market phase and anticipate a potential market top? David Keller, CMT breaks down three sentiment indicators he's watching in October 2024, explains their calculations and methodology, reviews their s... Read More
The Mindful Investor October 11, 2024 at 07:45 PM
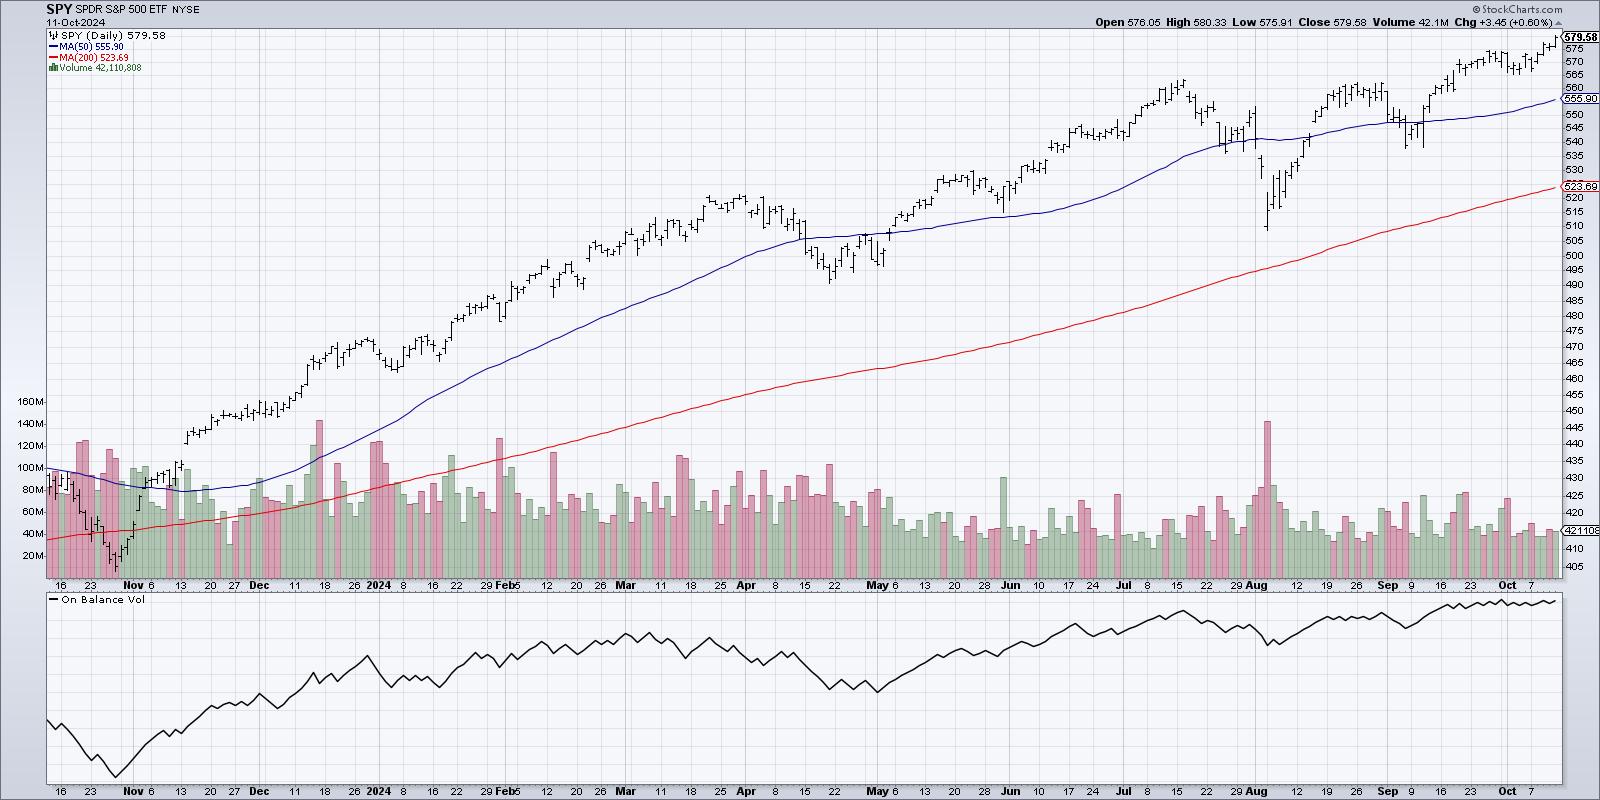
I was asked recently about volume, specifically why I don't feature volume often on my daily market recap show, CHART THIS with David Keller, CMT... Read More
The Mindful Investor October 09, 2024 at 12:53 PM
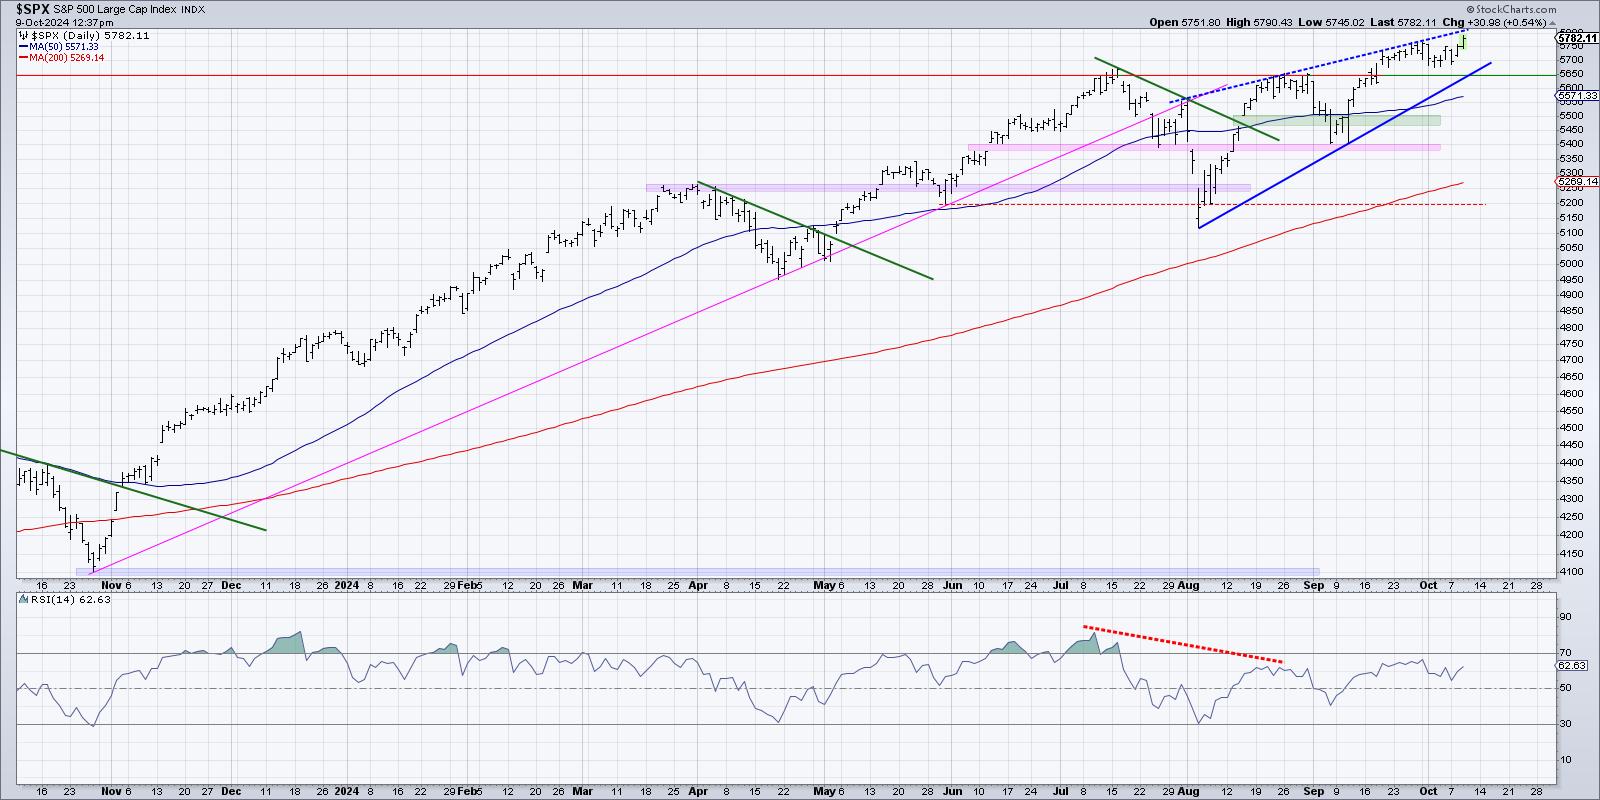
Even though the S&P 500 index appears to be relentlessly pursuing new all-time highs, the traditional seasonal weakness in October leads me to be very focused on risk management right about now... Read More
The Mindful Investor October 04, 2024 at 05:55 PM
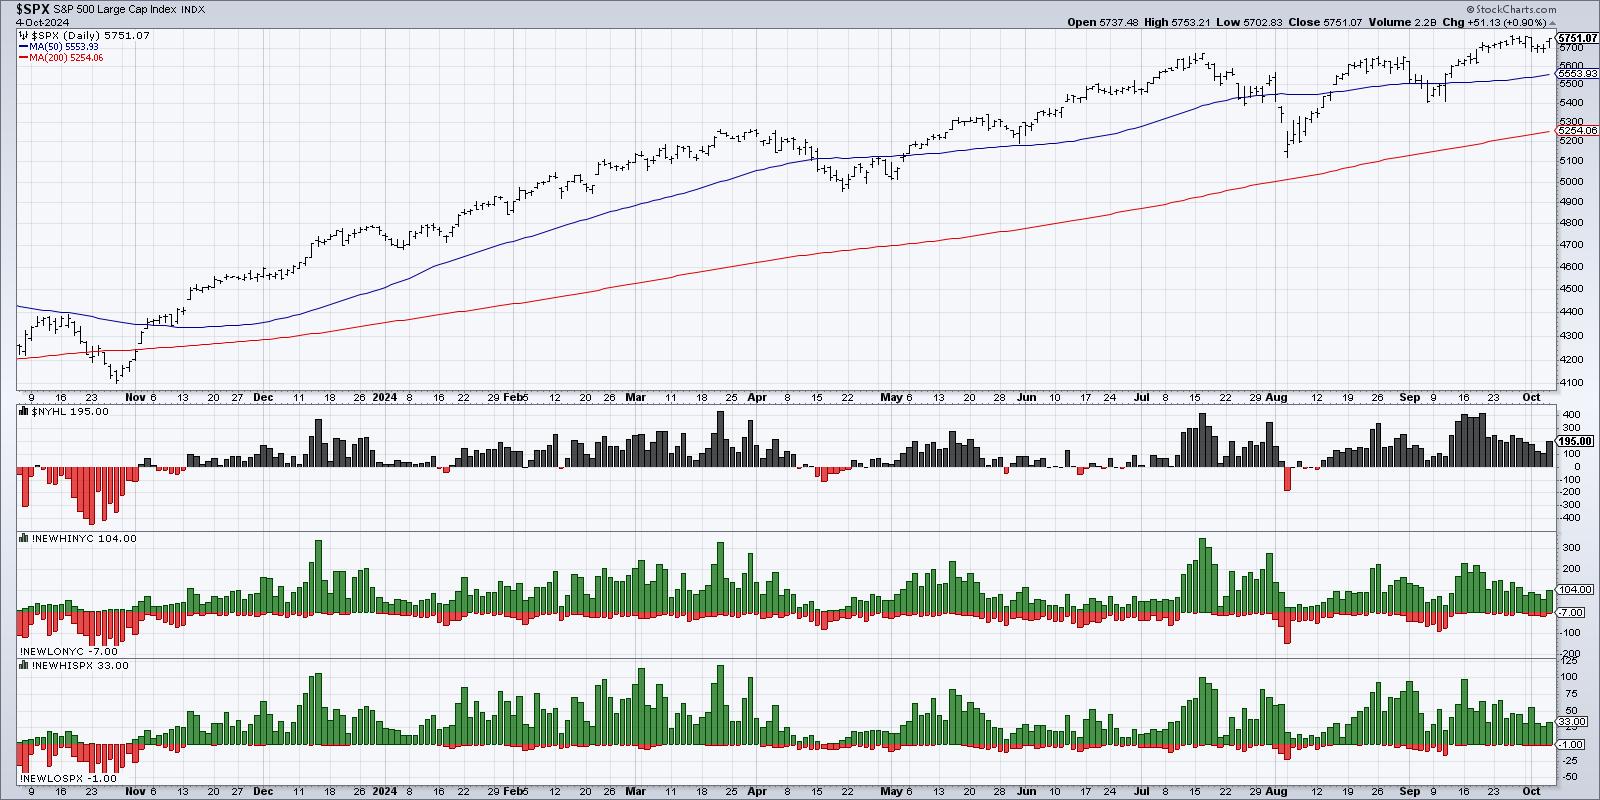
As a bull market reaches an exhaustion point, market breadth indicators often tend to diverge from the price action of the benchmarks. This "breadth divergence" occurs as leading names begin to falter, and initial selling drives some stocks down to new swing lows... Read More