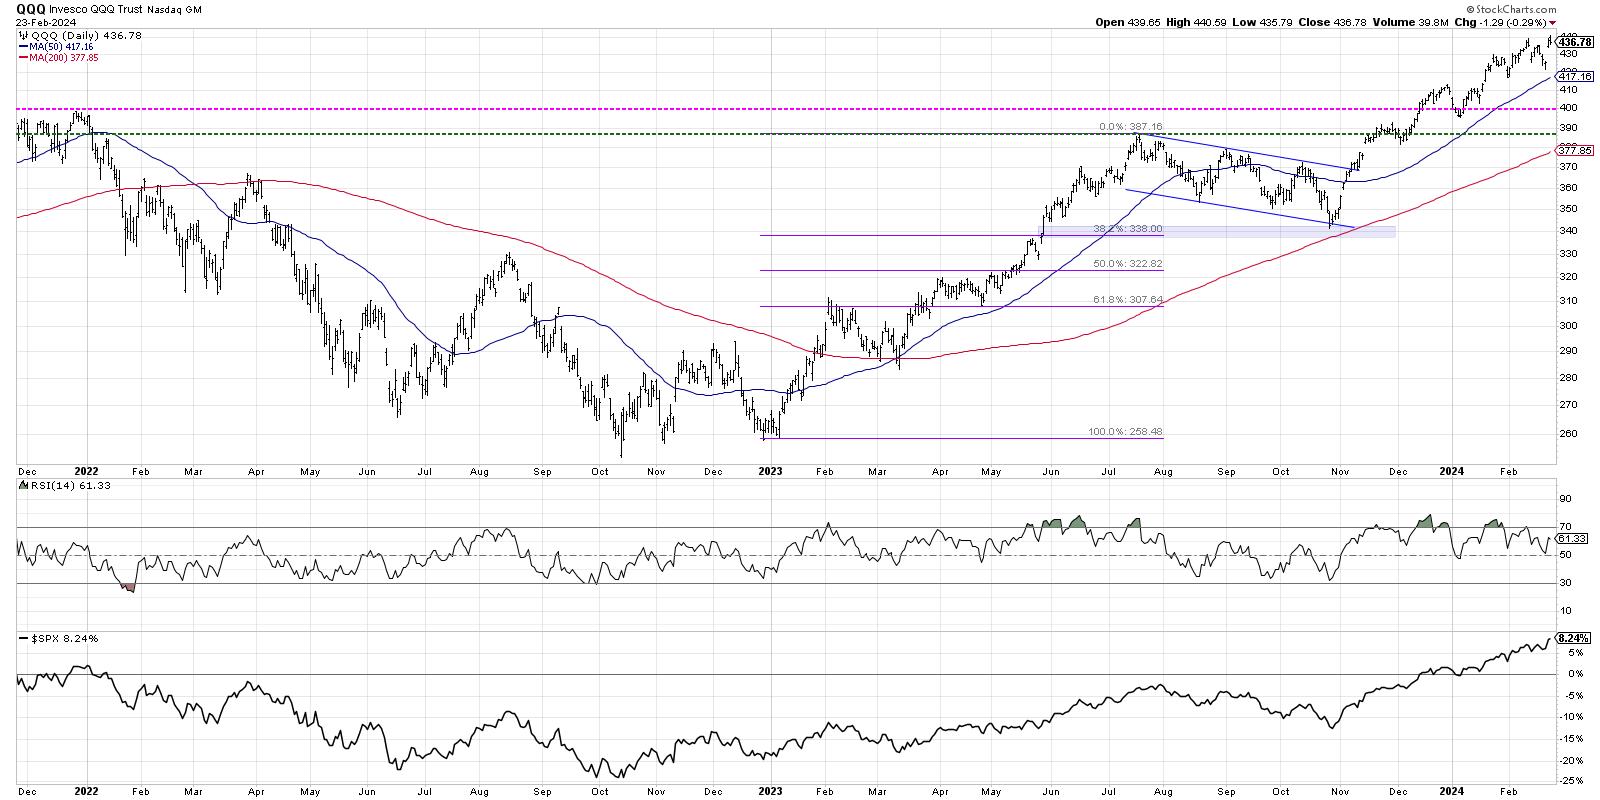
We've highlighted all the warning signs as this bull market phase has seemed to near an exhaustion point. We shared bearish market tells, including the dreaded Hindenburg Omen, and how leading growth stocks have been demonstrating questionable patterns. But despite all of those signs of market exhaustion, our growth-led benchmarks have been pounding even higher.
This week, Nvidia's blowout earnings report appeared to through gasoline on the fire of market euphoria, and the AI-fueled bullish frenzy appeared to be alive and well going into the weekend. As other areas of the equity markets have shown more constructive price behavior and volatility has remained fairly low, the question remains as to when and how this relentless market advance will finally meet its peak.
I would argue that the bearish implications of weaker breadth, along with bearish divergences and overbought conditions, still remain largely unchanged even after NVDA's earnings report. The seasonality charts for the S&P 500 confirm that March is in fact one of the weakest months in an election year. So will the Nasdaq 100 follow the normal seasonal pattern, or will the strength of the AI euphoria push this market to even further heights into Q2?
By the way, we conducted a similar exercise for the Nasdaq 100 back in November, and guess which scenario actually played out?
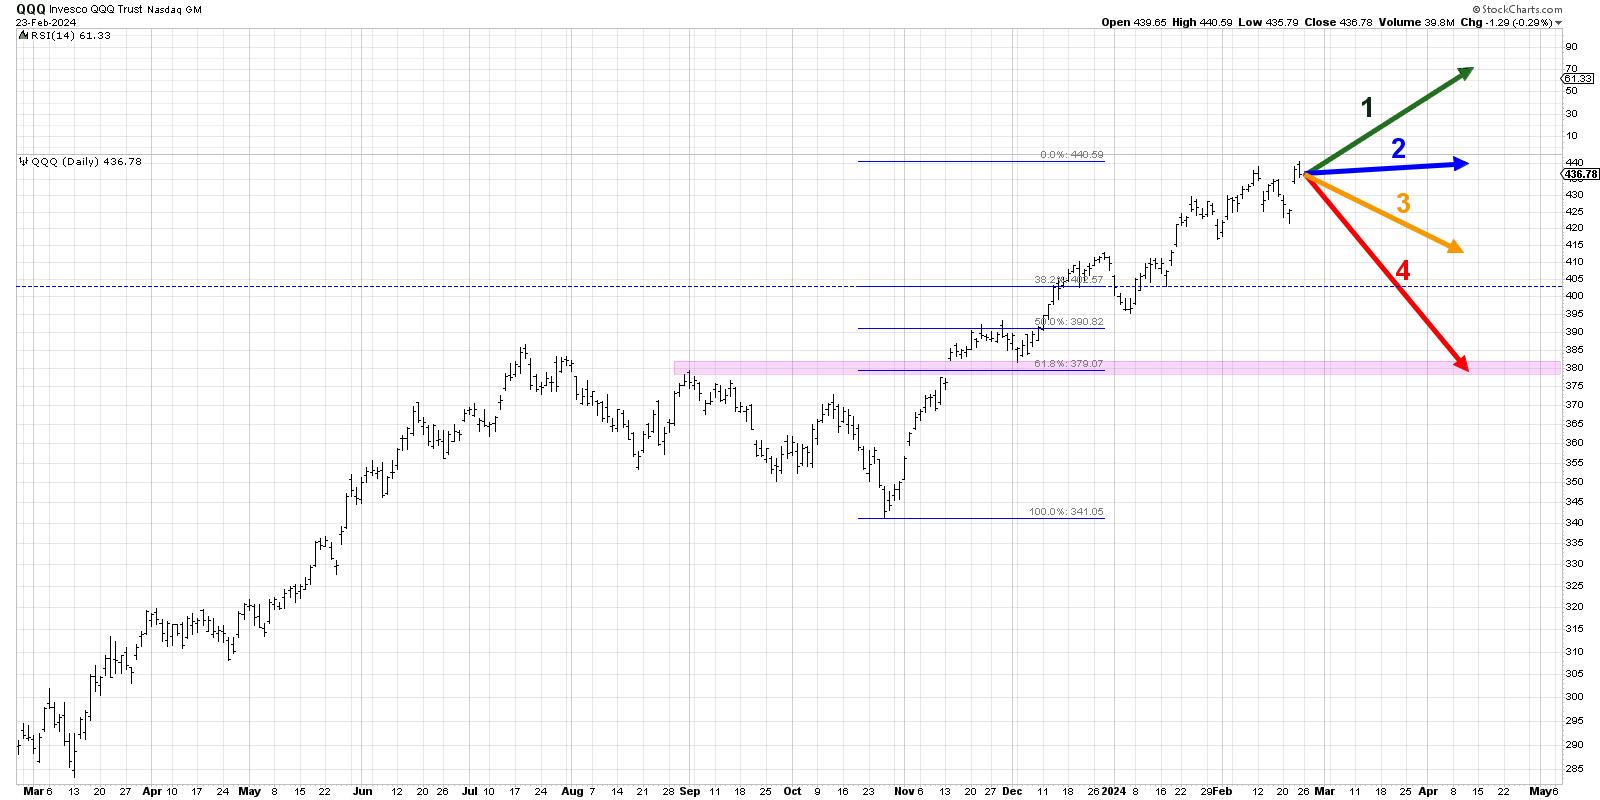
Today, we'll lay out four potential outcomes for the Nasdaq 100. As I share each of these four future paths, I'll describe the market conditions that would likely be involved, and I'll also share my estimated probability for each scenario. And remember, the point of this exercise is threefold:
- Consider all four potential future paths for the index, think about what would cause each scenario to unfold in terms of the macro drivers, and review what signals/patterns/indicators would confirm the scenario.
- Decide which scenario you feel is most likely, and why you think that's the case. Don't forget to drop me a comment and let me know your vote!
- Think about how each of the four scenarios would impact your current portfolio. How would you manage risk in each case? How and when would you take action to adapt to this new reality?

Let's start with the most optimistic scenario, involving even more all-time highs over the next six-to-eight weeks.
Option 1: The Very Bullish Scenario
The most optimistic scenario from here would mean the Nasdaq basically continues its current trajectory. That would mean another 7-10% gain into April, the QQQ would be threatening the $500 level, and leading growth stocks would continue to lead in a big way. Nvidia's strong earnings release fuels additional buying, and the market doesn't much care about what the Fed says at its March meeting because life is just that good.
In this very bullish scenario, value-oriented stocks, including Industrials, Energy, and Financials, would probably move higher in this scenario, but would still probably lag the growth leadership that would pound even higher.
Dave's Vote: 15%
Option 2: The Mildly Bullish Scenario
What if the market remains elevated, but the pace slows way down? This second scenario would mean that the Magnificent 7 stocks would take a big-time breather, and more of a leadership rotation begins to take place. Value stocks outperform as Industrials and Health Care stocks improve, but since the mega-cap growth names don't lose too much value, our benchmarks remain pretty close to current levels.
Dave's vote: 25%
Option 3: The Mildly Bearish Scenario
Both of the bearish scenarios would involve a pullback in leading growth names, and stocks like NVDA would quickly give back some of their recent gains. Perhaps some economic data comes in way stronger than expected, or inflation signals revert back higher, and the Fed starts reiterating the "higher for longer" approach to interest rates through 2024.
I would think of this mildly bearish scenario as meaning the QQQ remains above the first Fibonacci support level, just over $400. That level is based on the October 2023 low and also assumes that the Nasdaq doesn't get much higher than current levels before dropping a bit. We don't see defensive sectors like Utilities outperforming, but it's clear that stocks are taking a serious break from the AI mania of early 2024.
Dave's vote: 45%
Option 4: The Super Bearish Scenario
Now we get to the really scary option, where this week's upswing ends up being a blowoff rally, and stocks flip from bullish to bearish with a sudden and surprising strength. The QQQ drops about 10-15% from current levels and retests the price gap from November 2023, which would represent a 61.8% retracement of the recent upswing. Defensive sectors outperform and investors try to find safe havens as the market tracks its traditional seasonal pattern. Perhaps gold finally breaks above $2,000 per ounce, and investors start to talk about how a break below the October 2023 low may be just the beginning of a new bearish phase.
Dave's vote: 15%

What probabilities would you assign to each of these four scenarios? Check out the video below, and then drop a comment there for which scenario you select and why!
RR#6,
Dave
P.S. Ready to upgrade your investment process? Check out my free behavioral investing course!
David Keller, CMT
Chief Market Strategist
StockCharts.com
Disclaimer: This blog is for educational purposes only and should not be construed as financial advice. The ideas and strategies should never be used without first assessing your own personal and financial situation, or without consulting a financial professional.
The author does not have a position in mentioned securities at the time of publication. Any opinions expressed herein are solely those of the author and do not in any way represent the views or opinions of any other person or entity.
