 Most investors will admit that they have at some point been guilty of chasing yield. This is not surprising with the ultra low yields on money market accounts and the expanding Baby Boom generation’s needs for income. It’s a common refrain.
Problems arise when one does not completely understand the risks and potential costs associated with “stretching for higher yields”. In Action Practice #20, I offered you nine different exchange traded funds from which to choose, with yields being one of the attractions.
http://stockcharts.com/articles/journal/2017/08/charts-im-stalking-action-practice-20.html?
So plotting all nine on a PerfChart as we did in the blog is a solid start but hardly tells the whole story. Nevertheless, it’s useful to identify your personal investing timeframe and then consider those candidates to embrace and those to jettison from consideration. All have at at least ten years of history.
Since yield is what you are searching for, let’s rank the medalists with the caveat that both yield and price volatility can vary a good deal. Refer to your PerfChart with that in mind and ask yourself if the candidates historical volatility is tolerable to you personally. Based strictly on 12-month yields, the winners are as follows.
Gold Medal Winner: 12-month yield / WisdomTree High Dividend (DHS) at 3.1%.
Silver Medal Winner: Vanguard High Dividend Yield (VYM) at 2.94%.
Bronze Medal Winner: WisdomTree Total Dividend (DTD) at 2.5%.
Next, let’s consider expenses. Costs matter. They matter in the corporate world. They matter in the ETF arena and they matter in the Mutual Fund universe. I can’t overstate this fact. It’s money either in your pocket or the financial organization’s pocket. Which would you prefer? Therefore, the expense ratios amongst these nine candidates ranges from 0.08% up to 0.70%. Ask yourself if you really need to pay 775% more in expenses. Always ask.
Vanguard Dividend Appreciation (VIG) is the winner at 0.08%, as is Vanguard Dividend Yield (VYM) which is also at 0.08%. The Bronze medal goes to the SPDR S&P 500 (SPY) at 0.10%
The next factor I’ll label as Dividend Sustainability. Depending on how complex you are willing to build your spreadsheet, I’d consider factors such as the following:
A) Dividend growth over the trailing five years. The market rewards consistency and growth. Here, the Gold Medal goes to Vanguard High Dividend Yield (VYM) with 12.5% growth. Contrast that to Powershares Dividend Achievers (PFM) which achieved only 5.2% growth of its dividend over the trailing five years.
B) I like to look under the hood, so to speak, at the number of holdings and the average market cap of those holdings. For example, Vanguard High Dividend Yield (VYM) has 434 holdings with an average market cap of $85.9 Billion. The Blue Chip stocks it holds are less likely to cut dividends. The portfolio of well-diversified holdings also make me more comfortable. It’s largest positions are Microsoft (5%), Johnson & Johnson (3.75%) and Exxon (3.75%). The bluest of the blue. Contrast this to First Trust Value Line Dividend (FVD) with less than half those holdings (186) and a much smaller average market cap of $24.9 Billion. It is a fact that the dividends are riskier in smaller and midcap companies
C) The weighting methodology of the different ETFs is often overlooked but impactful nevertheless. For example, the aforementioned FVD is equally weighting all its holdings. Conversely, VYM is market cap weighted. There are differing opinions about which are better. My point is buyer beware. Know what you are getting.
The bottom line here is that investors must not simply focus on ‘yields’ in isolation. These other factors are impactful on both risk and reward and the probabilities associated with each. Remember that the market severely punishes firms that cut dividends. When firms stretch for dividend yield and fail, they are punished. Likewise, an investor who stretches for dividend yield may also be punished.
This Week’s Action Practice Charts:
My regular readership will know that a cornerstone of our book and the Tensile Trading methodology is to take advantage of probabilities based on the stock market’s “Law of Groupings”. In our book, we refer to it most often as the “sisters strategy”, and we describe how best to apply it in five of the ten stages to Stock Market Mastery. I’ve also written a number of blogs on this topic.
One of the most essential elements in taking full advantage of positive probabilities is to understand how to assemble the most appropriate “sisters”, whether they are sister stocks, sister ETFs or sister mutual funds. Doing this correctly yields benefits that carry through the stages of:
- Market Analysis
- Stalking
- Buying
- Monitoring
- Selling
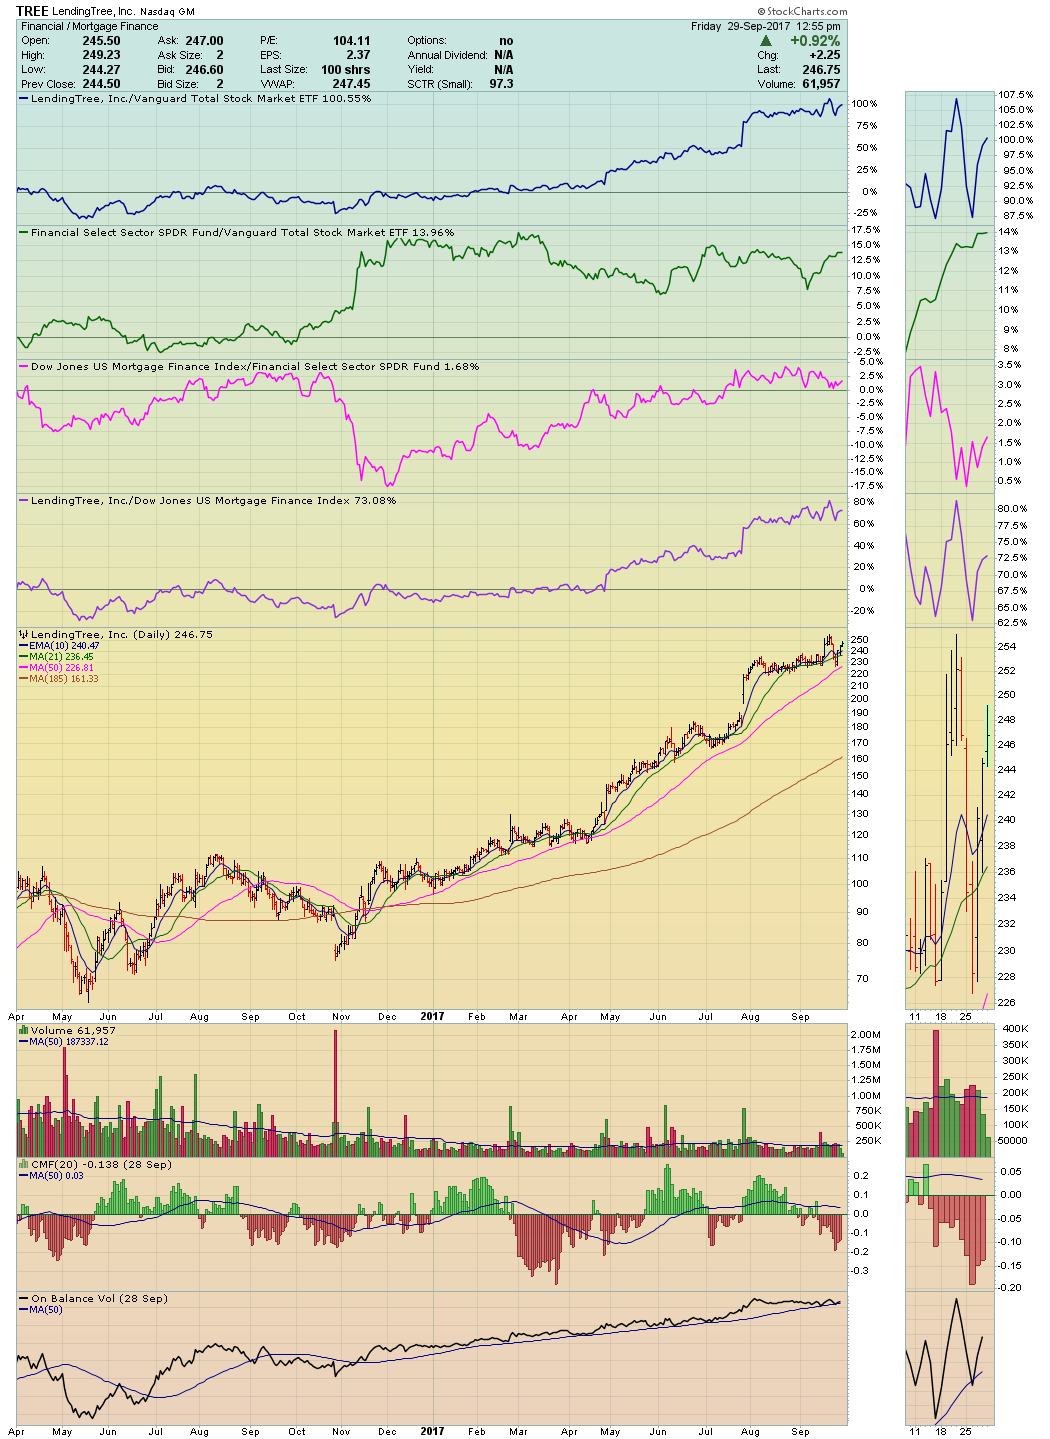
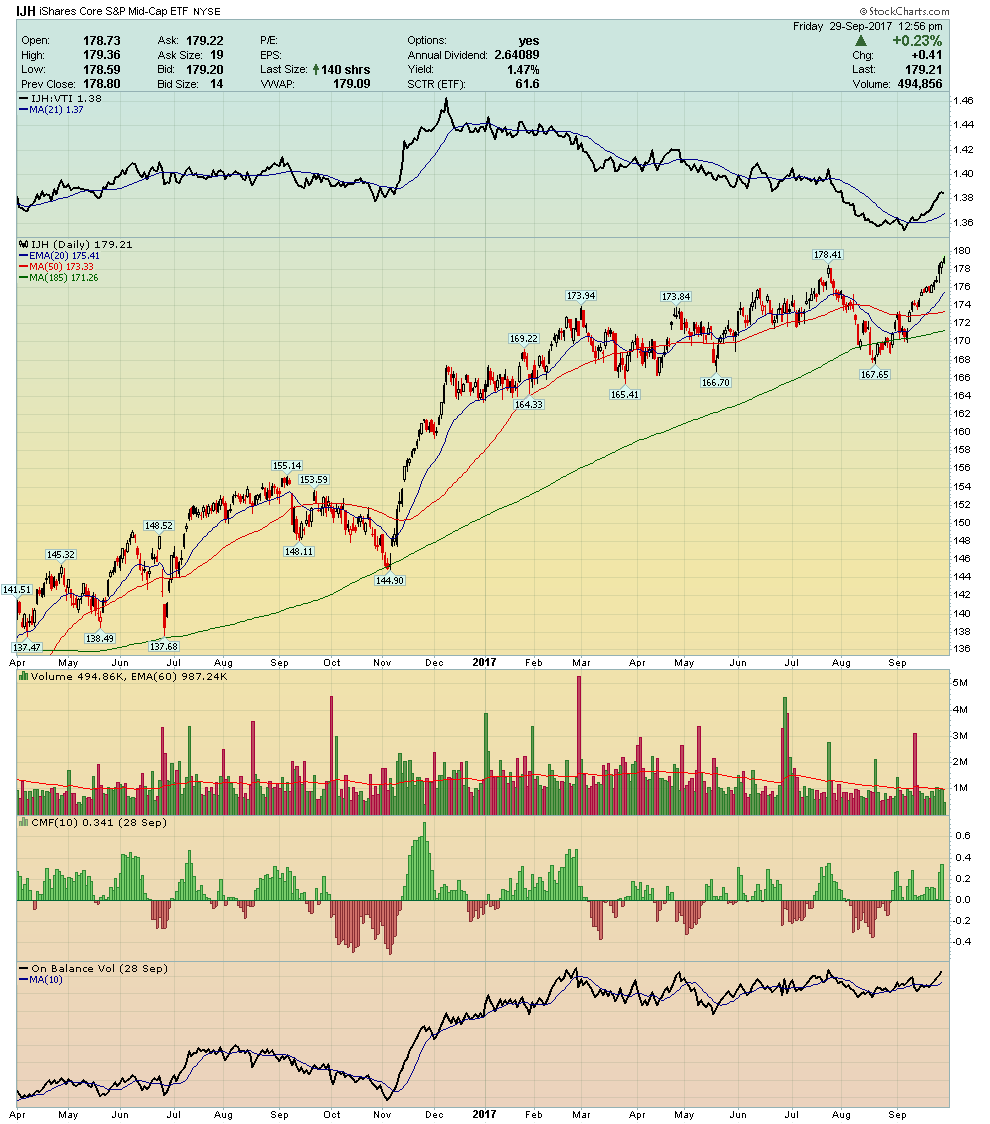
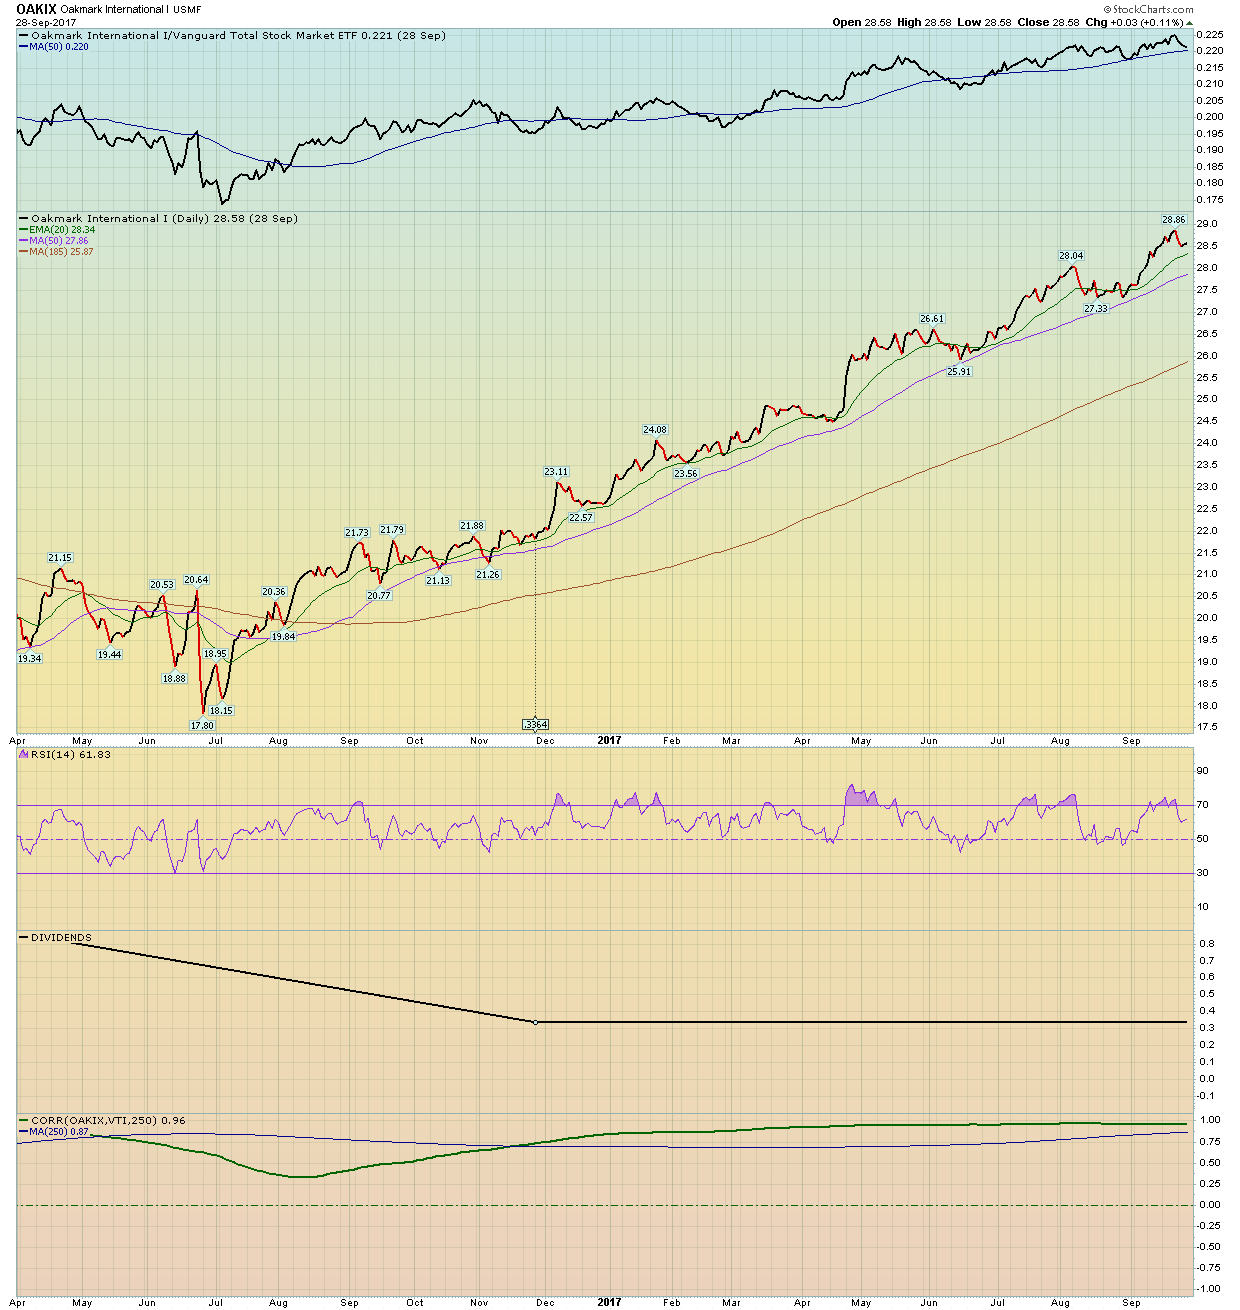
Those of you who have downloaded the Tensile Trading ChartPack know that the foundation of every ticker symbol we own is supported by a specific ChartList populated with the most appropriate sister equities, ETFs or mutual funds. Hence, the objective this week is to identify the best and most appropriate “sisters" for the three ticker symbols below. Hint — you should refer to other resources such as Investors Business Daily (IBD), NASAQ.com, ETF.com and Morningstar. The three tickers symbols are:
- Stock: LendingTree, Inc. (TREE)
- ETF: iShares Core S&P Mid-Cap (IJH)
- Mutual Fund: Oakmark International Investor (OAKIX)


Trade well; trade with discipline!
- Gatis Roze, MBA, CMT
- Grayson Roze
- Author, Tensile Trading: The 10 Essential Stages of Stock Market Mastery (Wiley, 2016)
- Presenter of the best-selling Tensile Trading DVD seminar
- Presenter of the How to Master Your Asset Allocation Profile DVD seminar
- Developer of the StockCharts.com Tensile Trading ChartPack
