 Straight from the pages of my own trading journal. These are my charts from all the market corrections since 1981. Here’s why I want to share these with you.
The beauty of technical analysis is that it represents human emotions expressed by the buying and selling behavior of investors – emotions which are predictably repeated in times of crisis and have not changed over time. In the midst of the present correction, I find that looking back at these charts stops me from doing anything rash or stupid.
Dan Ariely, a Professor of Behavioral Economics at Duke University, said this at the Yale Club in 2013. “In the present, we get tempted and misbehave time after time.” He explained how investors are apt to be swayed by short-term temptation without consideration or appreciation for long-term benefits or disadvantages. To fight that temptation, we must make use of self-control, which in turn will limit the influence that temptation has upon us.
I don’t want to list too many of my own conclusions concerning these charts as that would provide a disincentive for you to study all the market tops and bottoms to draw your own conclusions. Those are the personal insights with the most adhesive long-term quality. A lecture from me will be forgotten far quicker than those lessons you learn by digging into the charts yourself and finding lasting observations.
Before we get to those charts, I’d like to ask for your indulgence briefly. Having been a full-time trader for 25 years, I’ve been through six of these corrections since 1990. In 1987, I watched as so-called professional money managers panicked and trashed my portfolio. In fact, that was the precise moment when I decided it was essential that I learn to manage my own investments thereafter.
Here are some thoughts about our present markets – listed in no particular order:
- Remember that since 2009, the S & P 500 has rallied a whopping 320%.
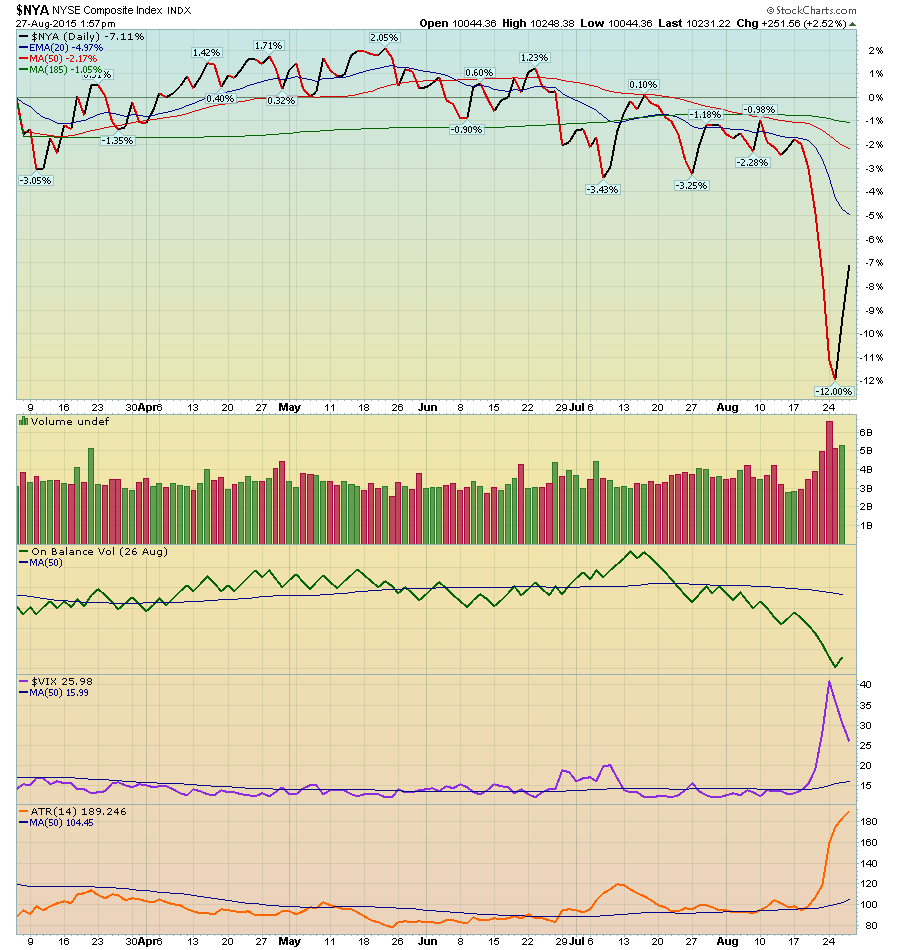
- Those of us who are money flow devotees will call 2015 the “year of distribution”. Check out On Balance Volume (OBV) since January in the NYSE.
- Breadth has been fading significantly since April, masked by fewer and fewer big names alone supporting the indexes. This is always a recipe for trouble.
- Market volatility is unnerving and inevitable, but now is not the time to abandon your investment plan. Panic is not – nor will it ever be – a profitable investing strategy.
- Reaffirm your commitment to the tried and true benefits of diversification and prudently rebalancing your portfolio. (Come to our Asset Allocation seminar on October 17th).
- With all the institutional investing these days, there will be times that the algorithm machines take over. Don’t be tempted to trade with the fast money that’s participating in the short term market timing lottery.
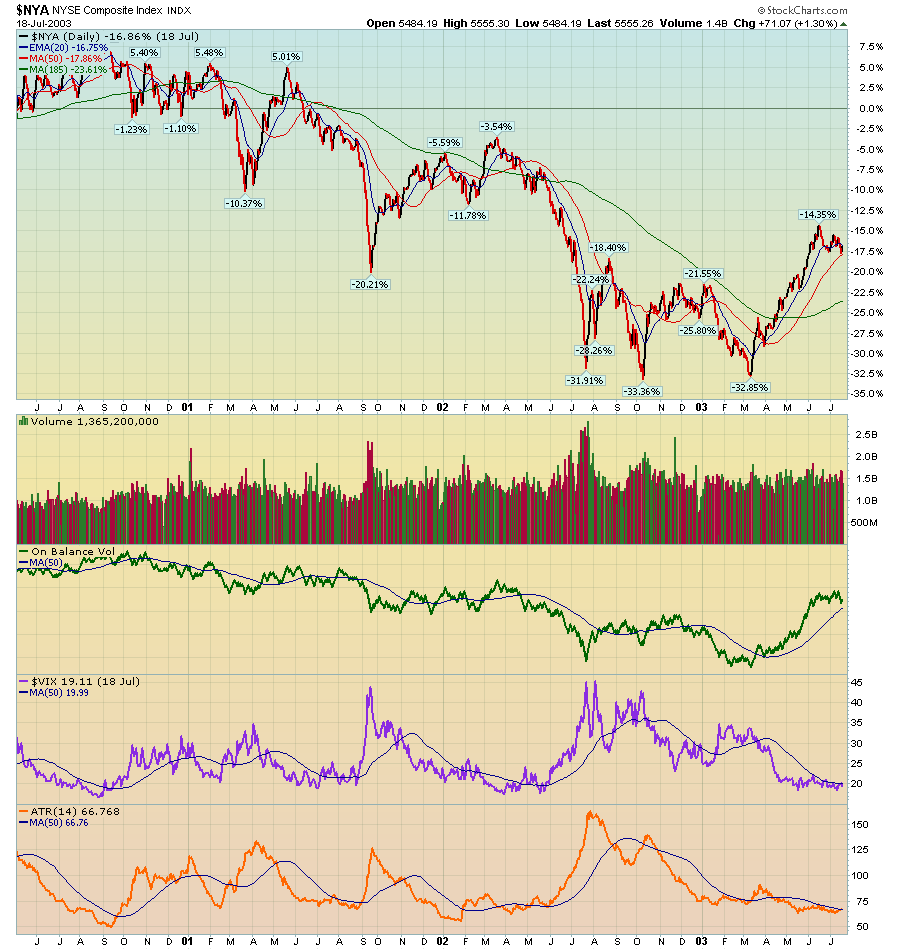
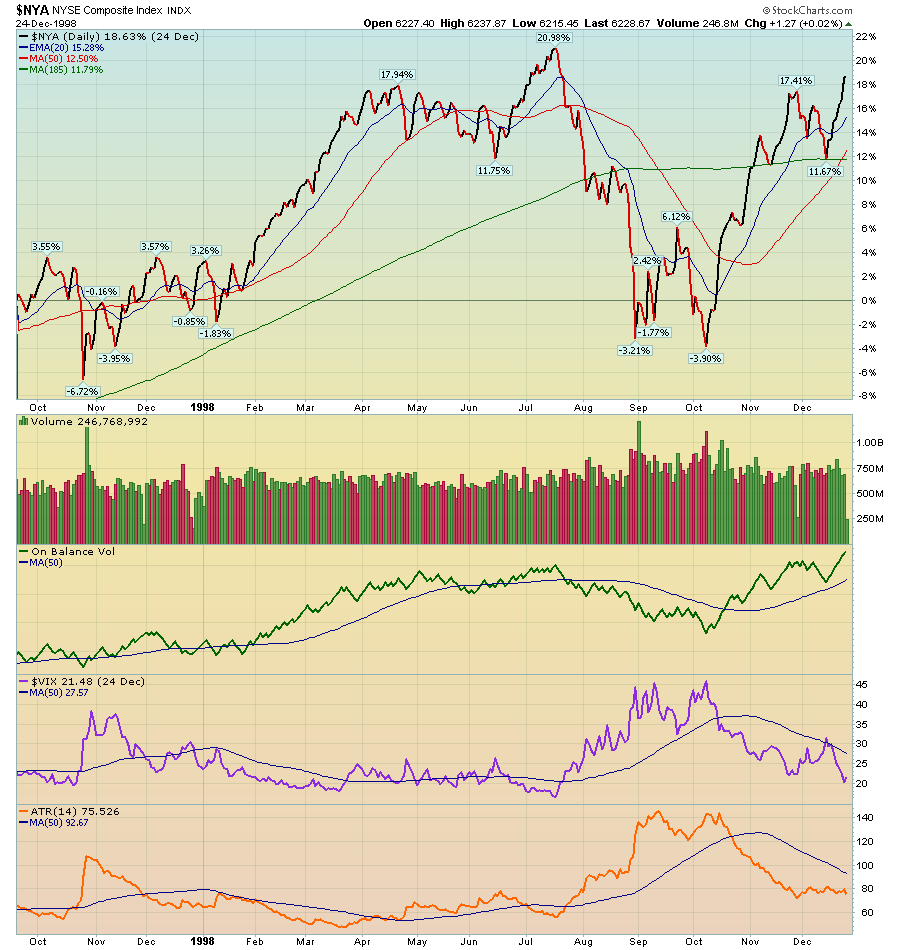
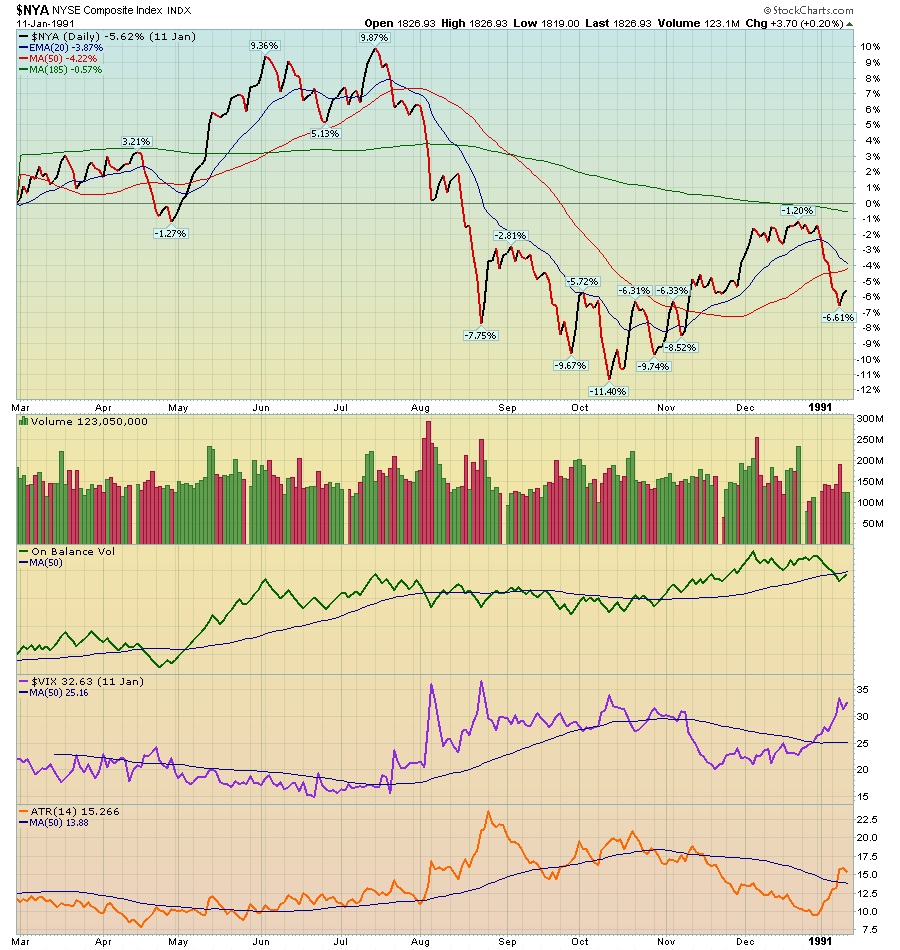
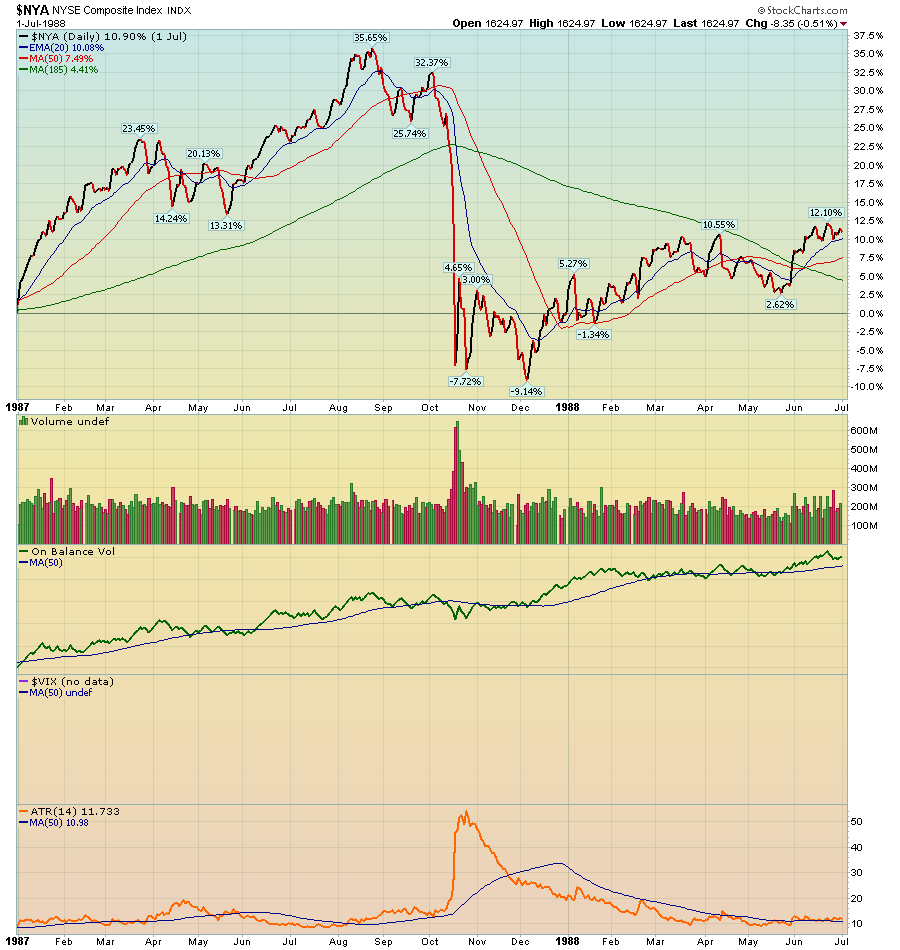
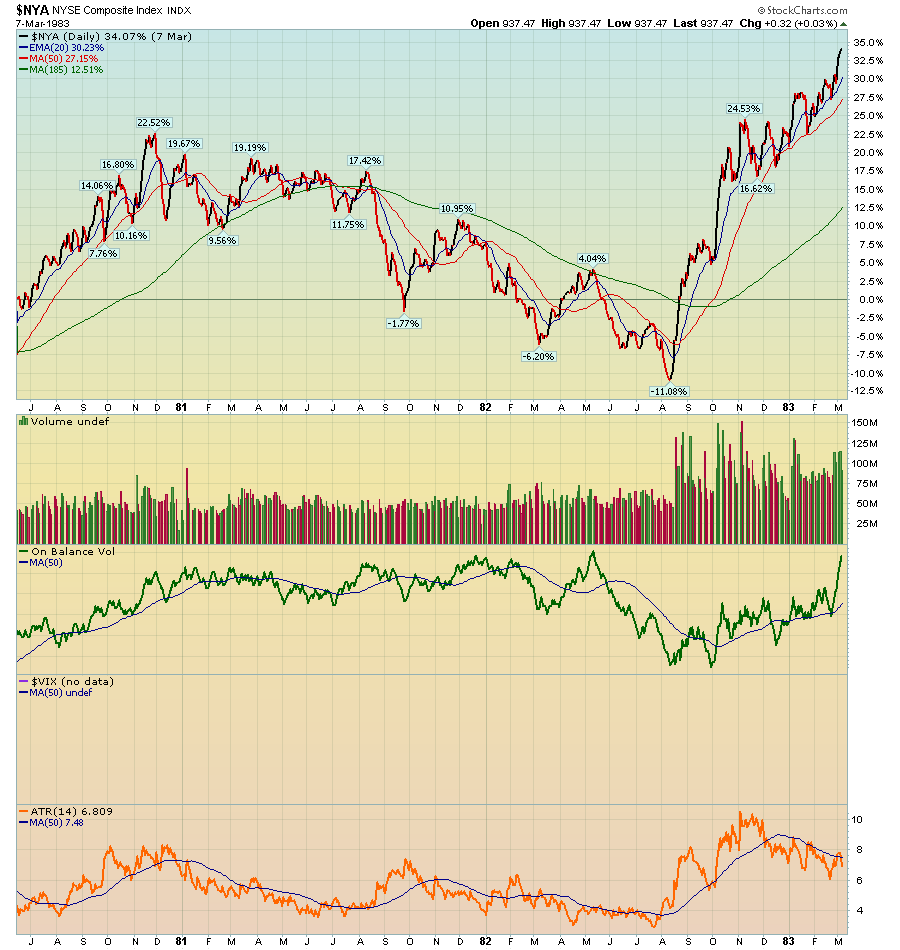
Now, back to the last nine market corrections since 1981. As you review these market tops and bottoms, I want you to note a few items:
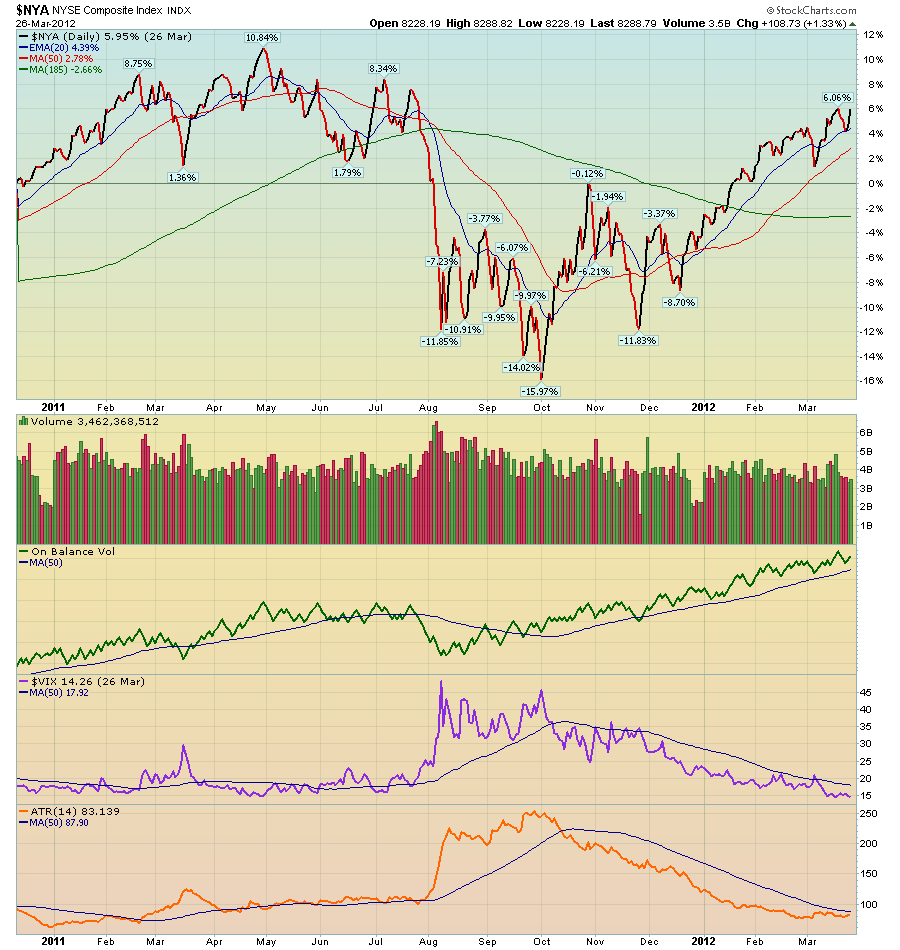
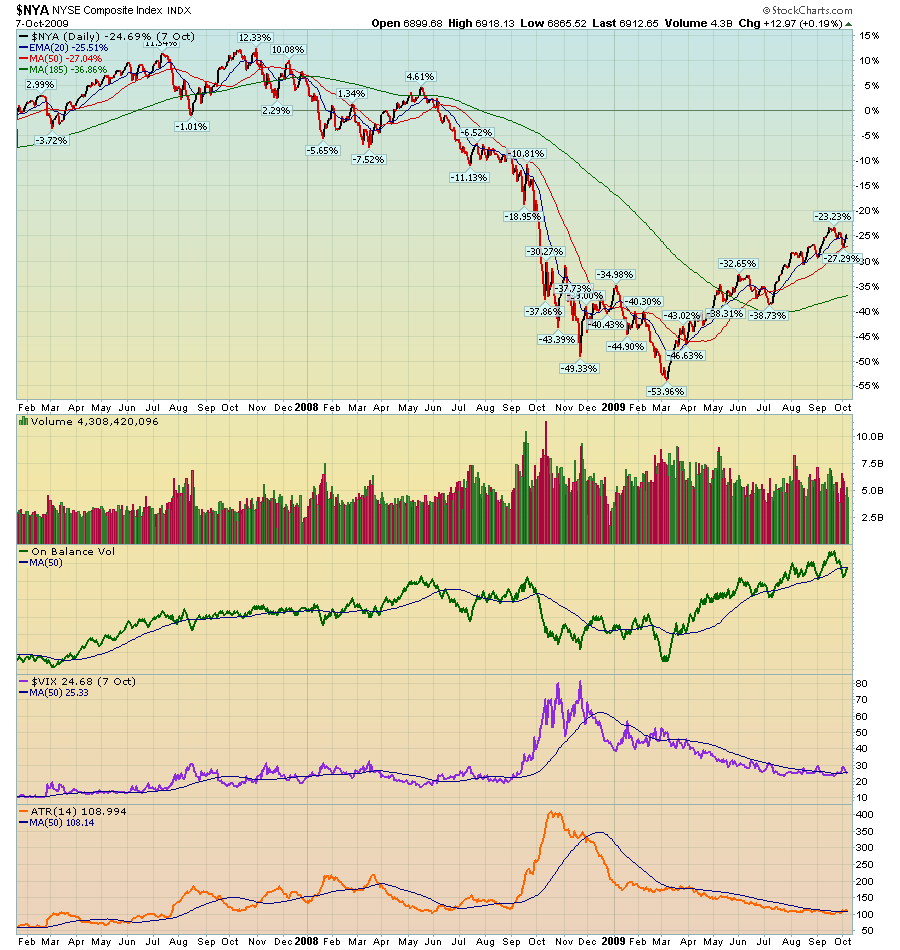
A) I used “Performance” charts so the percentages to the right are easier to compare.
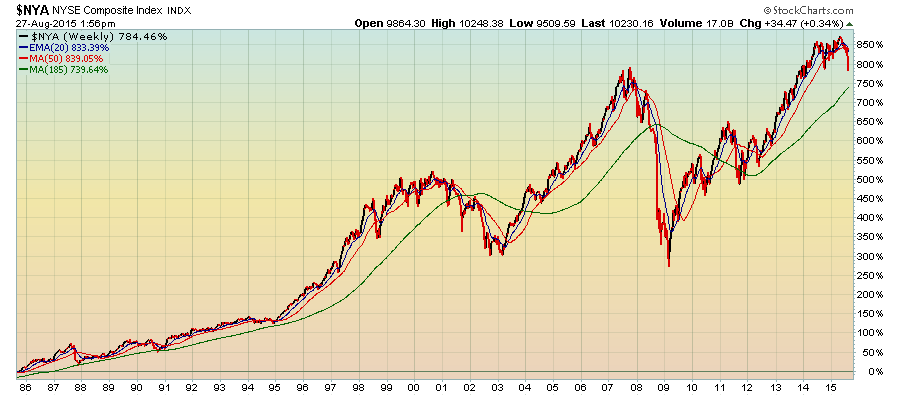
B) Start by reviewing the last 30 years’ chart. It’s been a profitable ride.
C) The “Fear Index” ($VIX) data only starts in 1990.
D) I use three moving averages. The 20-day is exponential for higher sensitivity. The 50-day and 185-day are simple moving averages. Pay close attention to the similarities in behavior of the moving averages amongst all the charts at market tops and when they turn up after a bottom.
E) As I mentioned earlier, I watch OBV closely. You should, too. The clues are not subtle.
F) Average True Range (ATR) is a ‘bell singer’ indicator. Note how it behaves at both turning points.
G) Please notice that none of these charts show a true “V” bottom where the market heads straight down, hits a bottom and then moves straight up.
H) Do your own chart pattern inventory. Most bottoms are triple or double bottoms, head and shoulder bottoms or sideways trading ranges where accumulation begins.
I hope you enjoy this homework assignment. Just remember that the market – not I – will be grading your insights in the coming months.
I’ve also installed these charts in a ChartList titled “10.45 Market Tops & Bottoms” which is available in my ChartPack.
https://store.stockcharts.com/products/tensile-trading-chartpack-by-gatis-roze
Trade well; trade with discipline!
- Gatis Roze, MBA, CMT
- Grayson Roze
- Author, Tensile Trading: The 10 Essential Stages of Stock Market Mastery (Wiley, 2016)
- Presenter of the best-selling Tensile Trading DVD seminar
- Presenter of the How to Master Your Asset Allocation Profile DVD seminar
- Developer of the StockCharts.com Tensile Trading ChartPack
