 Please refer to the charts of Charles Schwab (SCHW), PayPal (PYPL) and Morgan Stanley (MS/RA) that I presented to you in the Action Practice #2 blog I wrote on September 16, 2016.
http://stockcharts.com/articles/journal/2016/09/charts-im-stalking-action-practice-2.html
Just for fun , you might revisit Intersil Corp. (ISIL) which I presented to you in Action Practice #1. It’s up ten percent since the blog of September 2, 2016.
A few reminders about getting the most out of these Action Practice exercises. Do the analysis on the charts before the markets open on the following week. Then revisit your analysis when I present mine.
These Action Practice exercises will generally fall under one of the four stages of our Tensile Trading methodology. For now, we’ll focus on either stalking, buying, monitoring or selling. Perhaps in the future, once we get the readership fully comfortable with these exercises, we will make them more challenging.
The September 16, 2016 exercise was relatively straightforward as I was focused on one specific lesson. Here’s my analysis. Let’s call this the “Overhead Supply Exercise”. I presented you with three equities — all in the same sector and industry group. The key differences rested in the following facts:
a) Schwab (SCHW) was trading at $31 and had a cluster of buyers back in 2015 (November and December) who had paid a higher price of $33 - $34 per share. These investors presented potential sellers. SCHW had to attract enough buyers to work through this gaggle of sellers who presented potential resistance to achieving a new price high.
b) PayPal (PYPL), on the other hand, was trading at $41 with three previous areas of buying in the $40 - $42 range. Unlike Schwab, PayPal was making its fourth attempt to break through the last of this overhead supply.
c) Finally, Morgan Stanley (MS/RA) was trading at $23 which was above any previous overhead supply and was into true new-high territory.
Therefore, just focusing on the one element of “Overhead Supply”, I rated Morgan Stanley as my first pick, PayPal as my second, and Schwab coming in third.
Let’s drill down on Morgan Stanley and consider its other technical clues.
- Note how it broke out of a range bound basing pattern at the end of April at $20.25.
- It traded in a box / range for two months before breaking out into another new box / range ($21 - $21.75) for yet another two months.
- Note how On Balance Volume shows consistent accumulation beginning in mid-April during both trading boxes until August 22nd when accumulation explodes into full tilt.
- Also be aware that from August 19 - 22 with Morgan Stanley still in the trading range, there was serious buying volume showing up. It rallies strongly and then a second buying spike happens on September 8th.
- Clearly, with no overhead supply holding it back, Morgan Stanley is attracting institutional buying and we are willing to jump aboard.
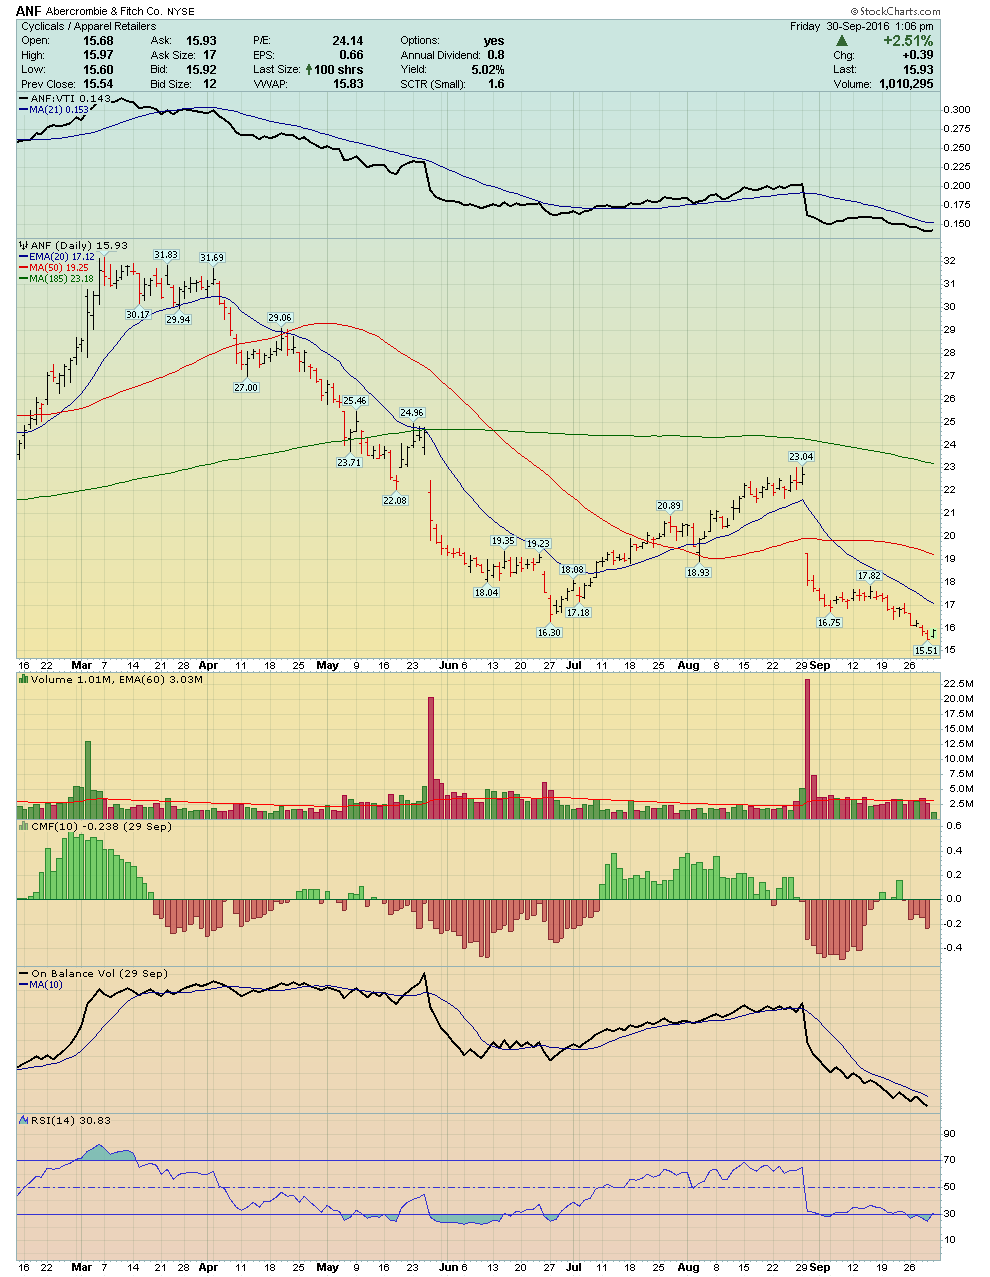
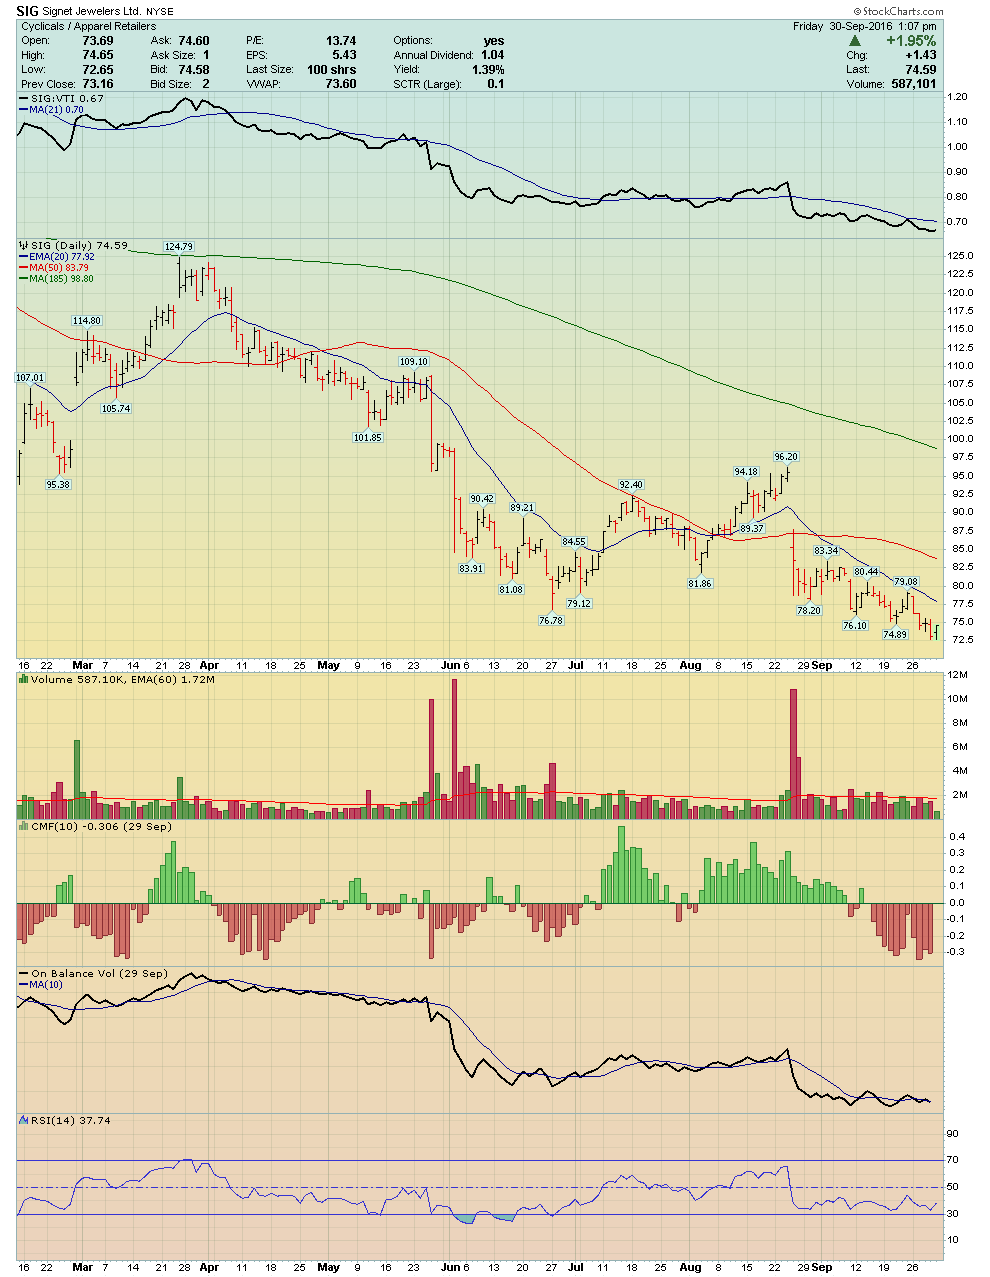
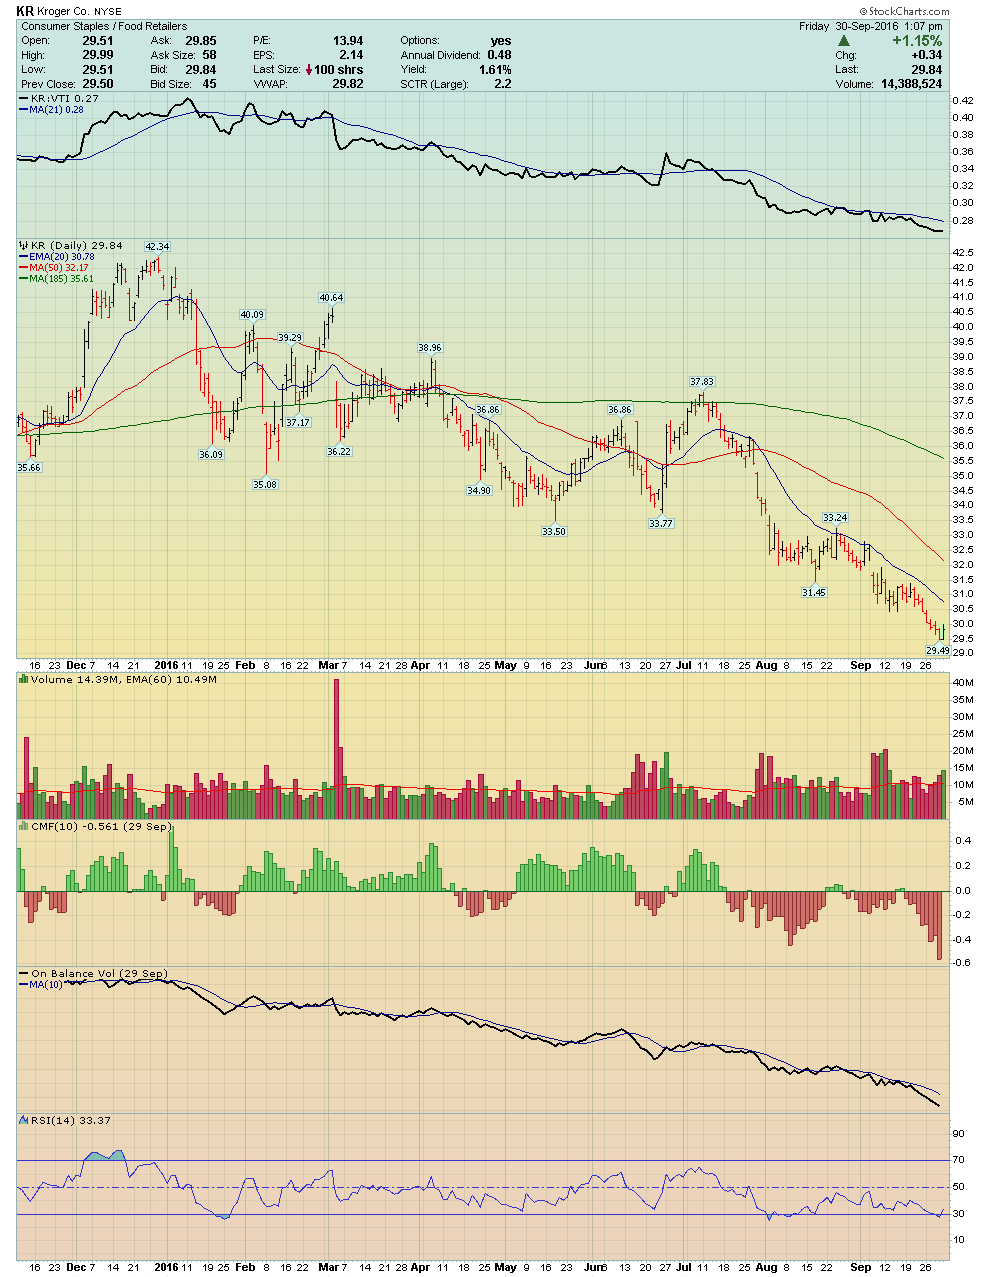
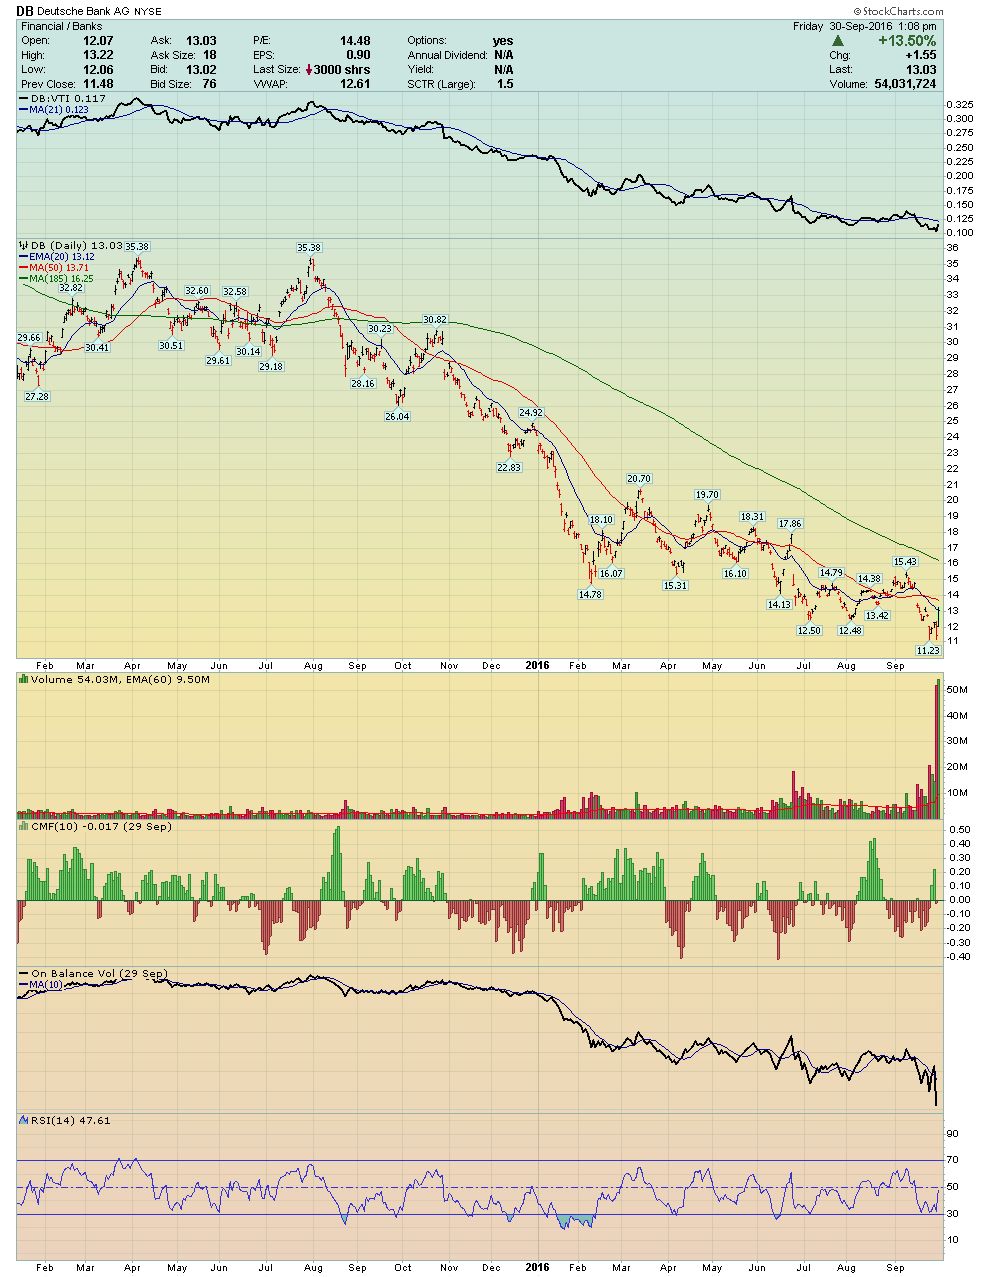
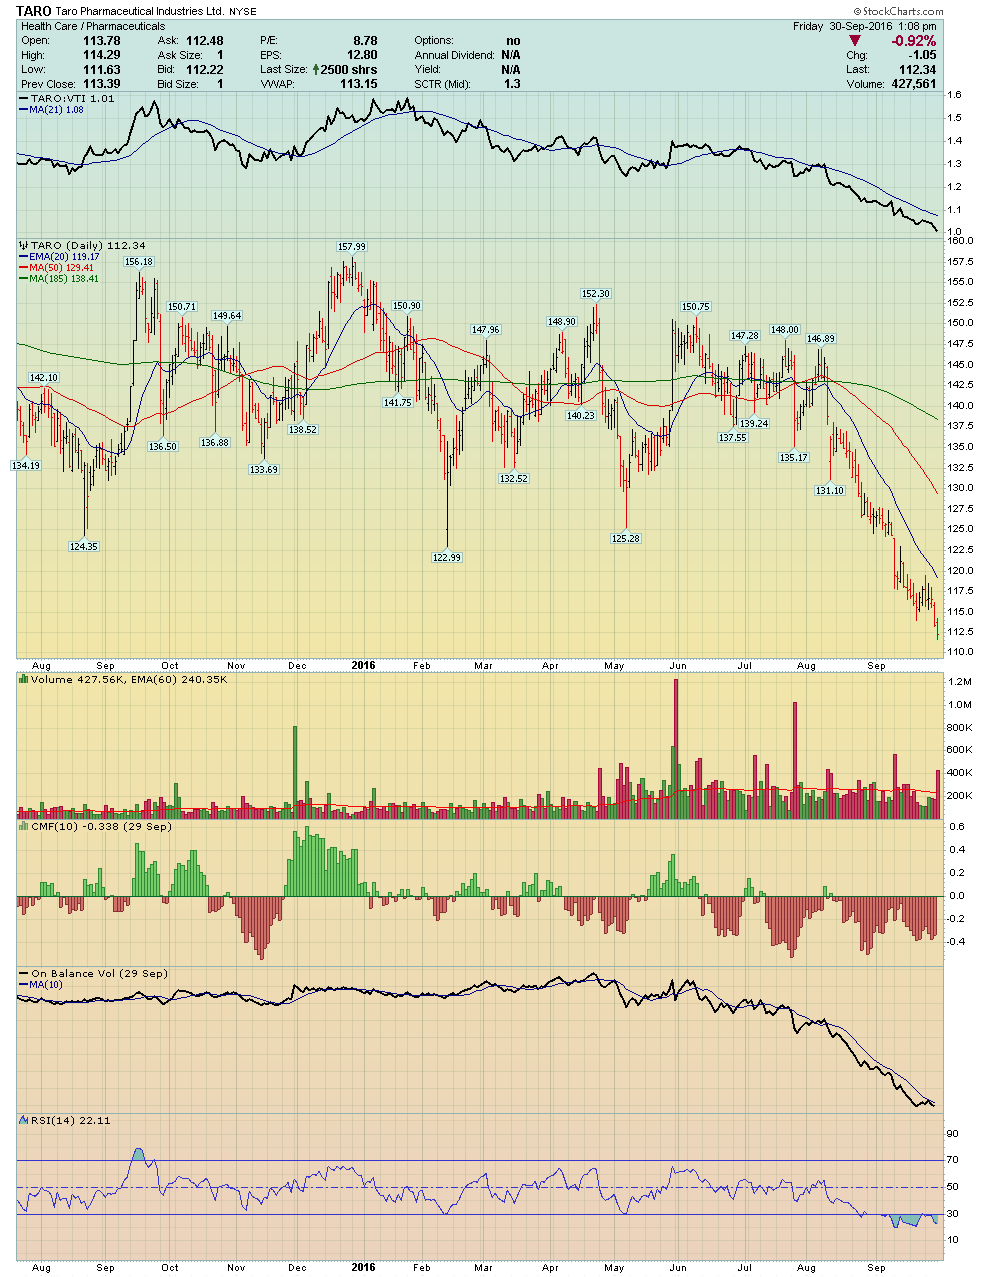
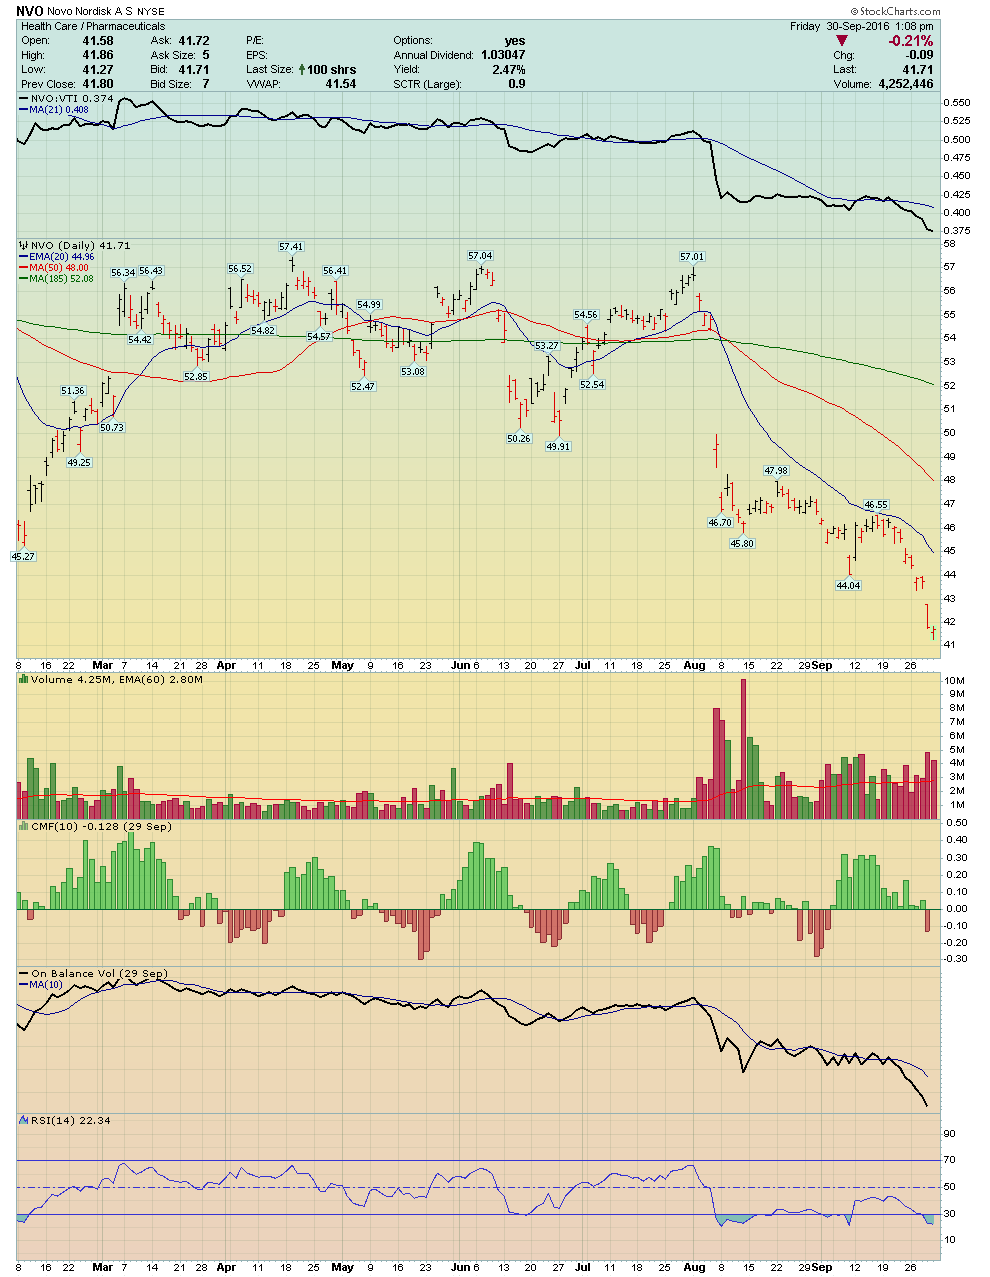
Onward. The Action Practice Exercise this week is Tensile Trading’s Stage #9 — the Selling Stage. For those of you who've read the book, you’ll know that we presented two methodologies — our own selling discipline, as well as a much more basic approach that novices on up can easily understand.
This exercise is focused on the Three Peaks Selling Strategy. It requires that you identify a price peak, followed by a second lower price peak, and finally followed by a third lower price peak which triggers your sell signal.
We’ve presented a wide variety of charts in numerous sectors and various industries. Your job is to identify the three sequential peaks and decide where you pull the trigger to exit. Bon chance! My analysis will follow in two weeks.
Trade well; trade with discipline!
- Gatis Roze, MBA, CMT
- Author, Tensile Trading: The 10 Essential Stages of Stock Market Mastery (Wiley, 2016)
- Presenter of the best-selling Tensile Trading DVD seminar
- Presenter of How to Master Your Asset Allocation Profile DVD seminar
- Developer of the StockCharts.com Tensile Trading ChartPack
