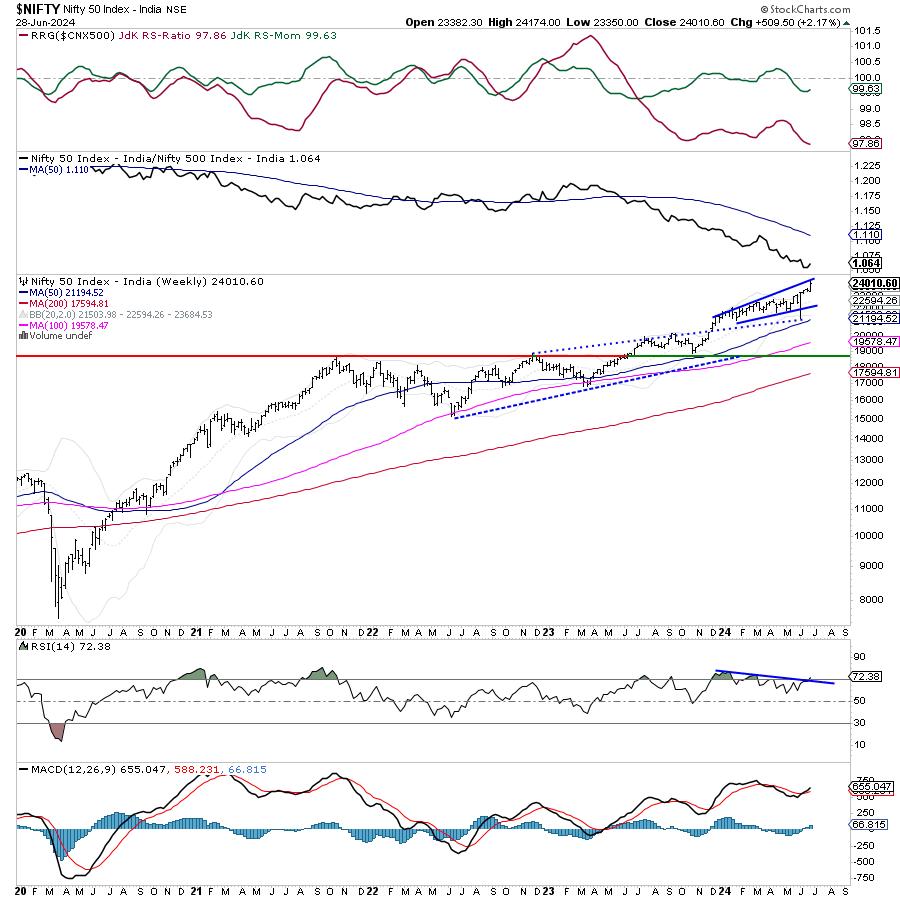
After consolidating in the week prior, the markets resumed their up move and have ended the present week on a strong note. The markets also navigated weekly derivatives expiry, showing some signs of fatigue and impending consolidation on the last trading day after rising for four trading sessions in a row. The trading range got a bit wider; the Nifty oscillated in an 824-point range over the past five days. Volatility also surged a bit; IndiaVix inched higher by 4.72% to 13.80. After trending through the week, the headline index closed with a net weekly gain of 509.50 points (+2.17%). The month has been even stronger; June ended with Nifty gaining 1479.90 points (+6.57%) on a monthly note.

From a technical perspective, the markets are showing initial signs of an impending consolidation from higher levels. Despite the trending move through the week, Nifty has created strong resistance in the 24000—24200 zone, as evidenced by the derivatives data. All through the week, the index has seen strong Call OI addition in the strikes falling in this range. On the monthly charts, a candle with a long lower shadow has emerged, which holds the potential of temporarily stalling the current up move. The Nifty now stands mildly overbought on weekly and monthly charts. Going by the technical structure, even if the markets mark incremental highs, they are now heavily prone to some measured corrective moves from the current or higher levels.
It is also important to note that the markets have again run too hard and ahead of themselves. The nearest MA, i.e., 20-week MA, is currently placed at 22594, which is over 1400 points below the current close. The 50-week MA is placed at 21194, which is over 2800 points below the current close. This means that even if there is the slightest mean reversion taking place, we may see the markets coming off significantly from the current levels. If it does that, even then, it will keep its primary uptrend intact. Monday is likely to see a muted start to the week; the levels of 24200 and 24350 are likely to act as immediate resistance levels. The supports are likely to come in lower at the 23900 and 23750 levels.
The weekly RSI stands at 72.38; it remains mildly overbought. The RSI has marked a new 14-period high; however, it is still neutral and does not show any divergence against the price. The weekly MACD is bullish and remains above its signal line.
The pattern analysis of the weekly chart shows that the prices have closed above the upper Bollinger band. This is generally regarded as bullish even if there is a temporary retracement inside the band. However, looking at the over-extended structure, there is a higher chance of the price pulling itself back inside the band again.
Overall, it is strongly recommended that, even if we see the markets attempting to inch higher, one must focus on guarding profits at higher levels rather than giving a blind chase to the up move. It would be important to rotate the stocks and sectors effectively so that one stays invested in relatively stronger stocks. The pockets like IT and FMCG are also seen improving their relative momentum and are expected to do well. By and large, while keeping the leveraged exposures at modest levels, it is recommended that you approach the markets with a cautious approach over the coming week.
Sector Analysis for the Coming Week
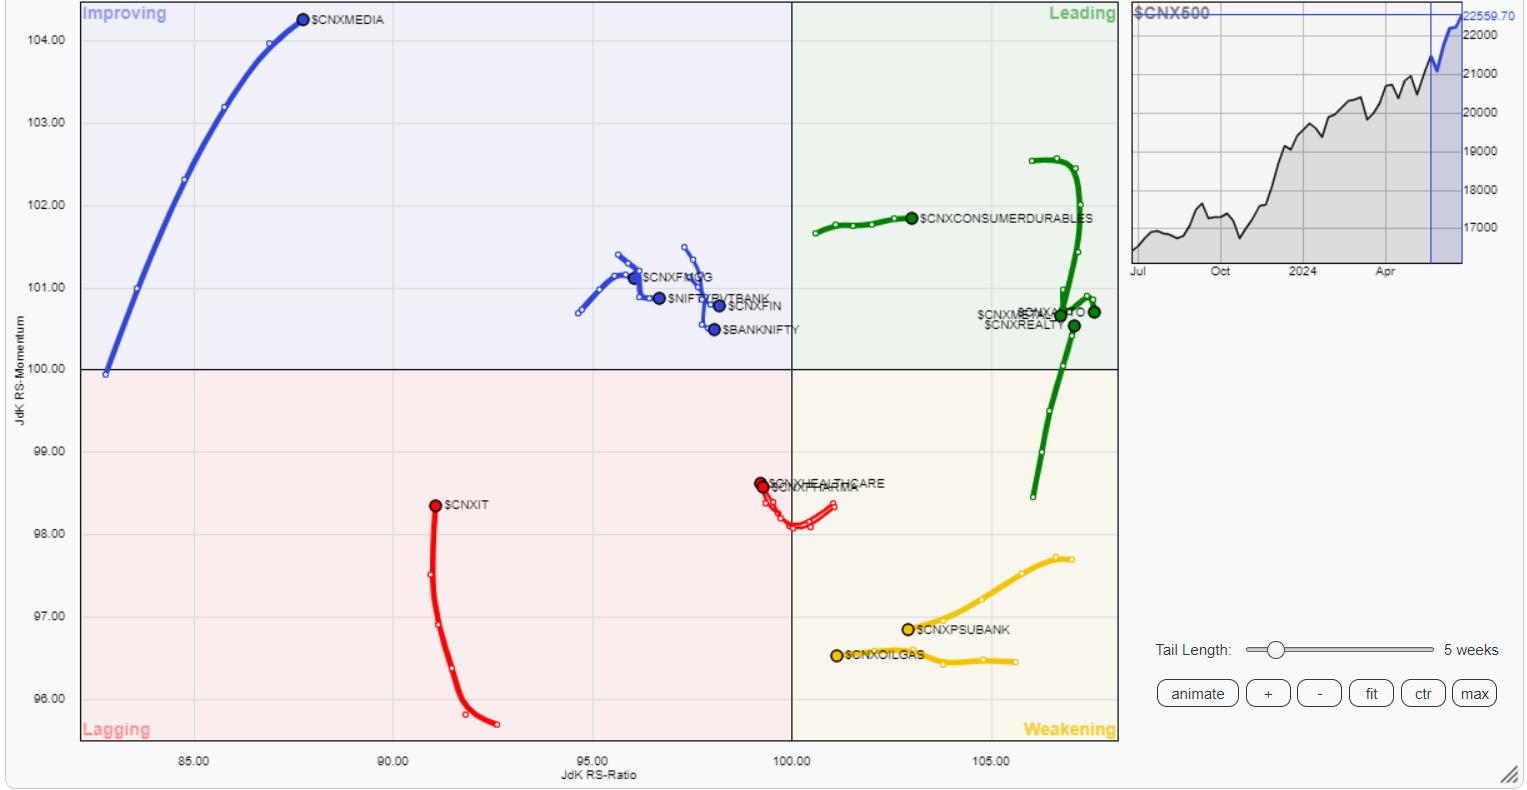
In our look at Relative Rotation Graphs®, we compared various sectors against CNX500 (NIFTY 500 Index), which represents over 95% of the free float market cap of all the stocks listed.

Relative Rotation Graphs (RRG) show that the Nifty Consumption, Auto, Midcap 100, and Metal indices are placed inside the leading quadrant. These groups are expected to relatively outperform the broader markets. However, the Auto, Consumption, and Metal indices are also seen paring their relative momentum against the broader market. The Realty Index is also firmly placed inside the leading quadrant.
The Nifty Commodities, Energy, PSU Bank, Infrastructure, and PSE indices are placed inside the weakening quadrant. Individual stock performances may be seen from these groups but, collectively, they may be slowing down on their relative performance.
The Services Sector Index is inside the lagging quadrant. Besides this, the IT and Pharma Indices are also inside the lagging quadrant, but can be seen improving their relative momentum against the broader Nifty 500 index.
Banknifty, Nifty Media, Financial Services, and FMCG indices are placed inside the improving quadrant.
Important Note: RRG™ charts show the relative strength and momentum of a group of stocks. In the above Chart, they show relative performance against NIFTY500 Index (Broader Markets) and should not be used directly as buy or sell signals.
Milan Vaishnav, CMT, MSTA
Consulting Technical Analyst
www.EquityResearch.asia | www.ChartWizard.ae
