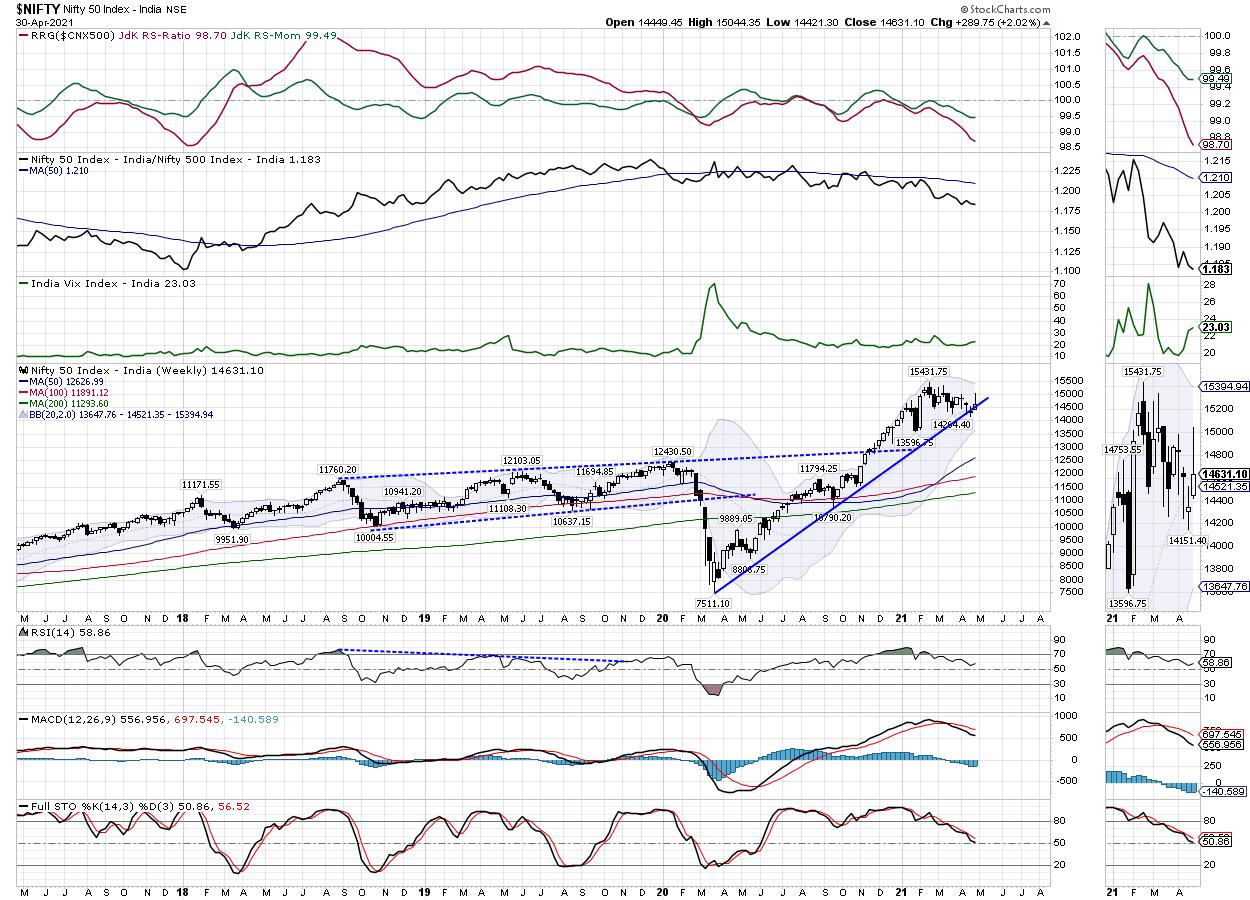
In a week where the trading range remained wider than usual, the Indian equities took a serious cut on the Friday's session; however, they managed to close the week on a positive note. In the previous weekly note, it was mentioned that the NIFTY was trading inside the falling channel that it had created; any decisive move above 15000 would give an upward directional cue to the markets. However, the Index failed to move past that point and stayed inside the channel. Following a wide-ranging week, the headline index finally ended with net gains of 289.75 points (+2.02%) on a weekly basis.

In the week before this one, the NIFTY had violated an important pattern support, which comes in form of a rising trend line drawn from the lows of March 2020. Despite the violation of this pattern support this time, it has averted weakness by managing to hang around precariously near this trend line. The volatility remained absent as the INDIAVIX rose marginally by 1.49% to 23.0300. For the coming week and beyond, it would be crucially important for the NIFTY to stay above this trend line; any failure to do so will increase the possibility of violation of the falling channel that the NIFTY is in, which can also invite incremental weakness in the markets.
The coming week is likely to see a soft start to the trade. The levels of 14730 and 14900 will act as resistance; the levels of 14500 and 14350 will act as supports. In the event of any corrective move, the trading range is expected to get wider.
The weekly RSI stands at 58.86; it remains neutral and does not show any divergence against the price. The weekly MACD is bearish and is still below its signal line. A shooting star formation was seen on the Candles. Such a formation would occur when the price gaps up, trends higher yet closes much lower, as it is not able to sustain gains. Since such a candle has emerged near a pattern resistance level, it can have bearish implications. However, as always, this would require confirmation on the next bar.
The pattern analysis shows the NIFTY inside the channel it has formed; it was not able to break out of the of this channel and now clings to the important pattern support of a trend line, which begins from the March 2020 lows and joins the subsequent higher bottoms.
All in all, the markets are within a corrective retracement following the formation of the high point at 15431. While the markets are in under such retracement, the out-of-control COVID situation in the country is hitting the market sentiments hard. There is a clear shift of preference towards the traditionally defensive stocks. We recommend staying highly stock-specific and keep fresh purchases limited to low beta and defensive stocks. All rallies should be used more for taking some money off the table rather than making purchases. While keeping overall exposures at a modest level, a highly cautious outlook is advised for the coming week.
Sector Analysis for the Coming Week
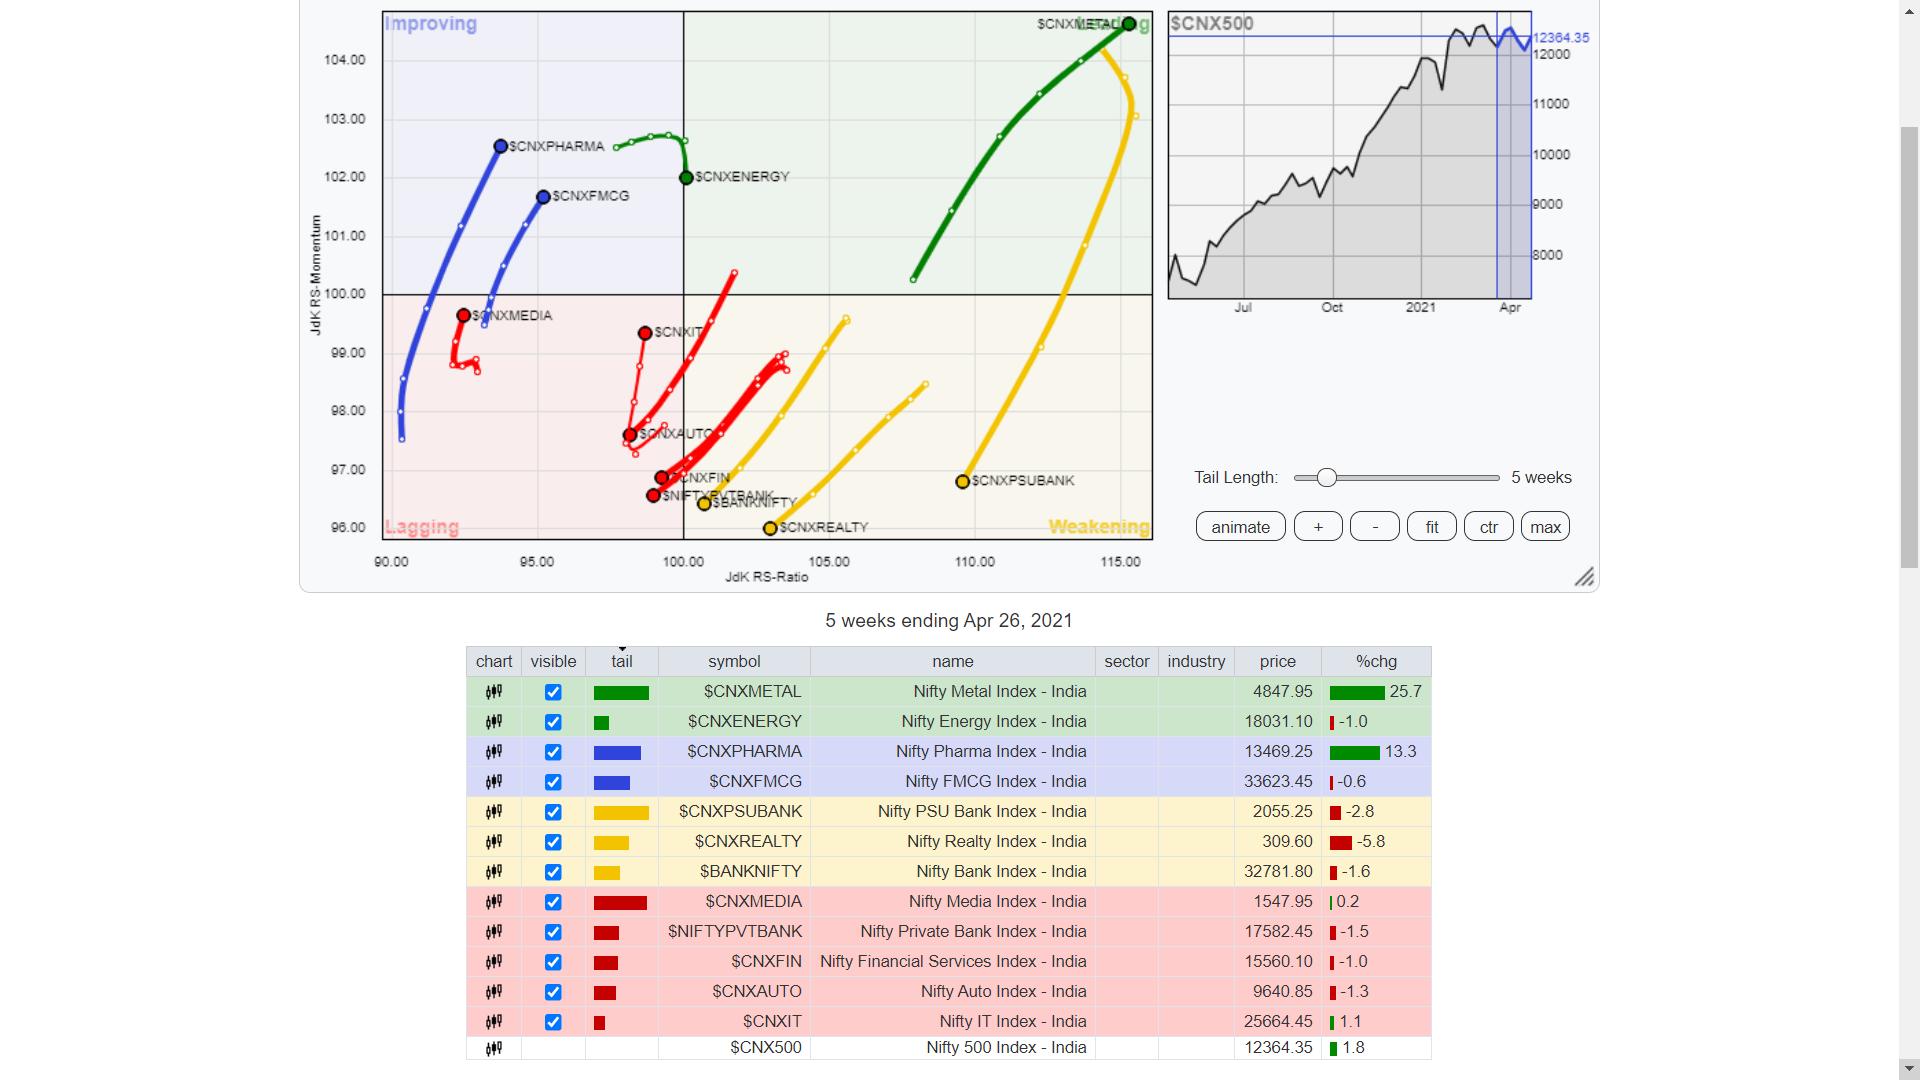
In our look at Relative Rotation Graphs®, we compared various sectors against CNX500 (NIFTY 500 Index), which represents over 95% of the free float market cap of all the stocks listed.

Our review of Relative Rotation Graphs (RRG) shows that only Metal, the Midcap 100 and the Commodity Indexes are showing steady relative momentum while placed inside the leading quadrant. The Energy, Infrastructure and PSE Indexes are inside the leading quadrant, but they all appear to be losing their relative momentum against the broader markets.
The NIFTY PSU Bank Index, Realty and NIFTY Bank Index are inside the weakening quadrant. All these indices appear to be rotating south-west and are giving up their relative momentum against the broader markets. They are likely to relatively underperform the broader markets.
The NIFTY Financial Services index has rolled inside the lagging quadrant. The NIFTY Auto Index is also languishing inside the lagging quadrant. NIFTY IT and Media are also inside the lagging quadrant, but they appear to be improving their relative momentum against the broader markets.
NIFTY Consumption has just rolled inside the improving quadrant. It joins NIFTY Pharma and NIFTY FMCG, which are also inside the quadrant. They appear to be steadily maintaining their relative momentum against the broader markets and are likely to show resilient performance, relatively outperforming the general markets.
Important Note: RRG™ charts show the relative strength and momentum for a group of stocks. In the above chart, they show relative performance against NIFTY500 Index (Broader Markets) and should not be used directly as buy or sell signals.
Milan Vaishnav, CMT, MSTA
Consulting Technical Analyst,
