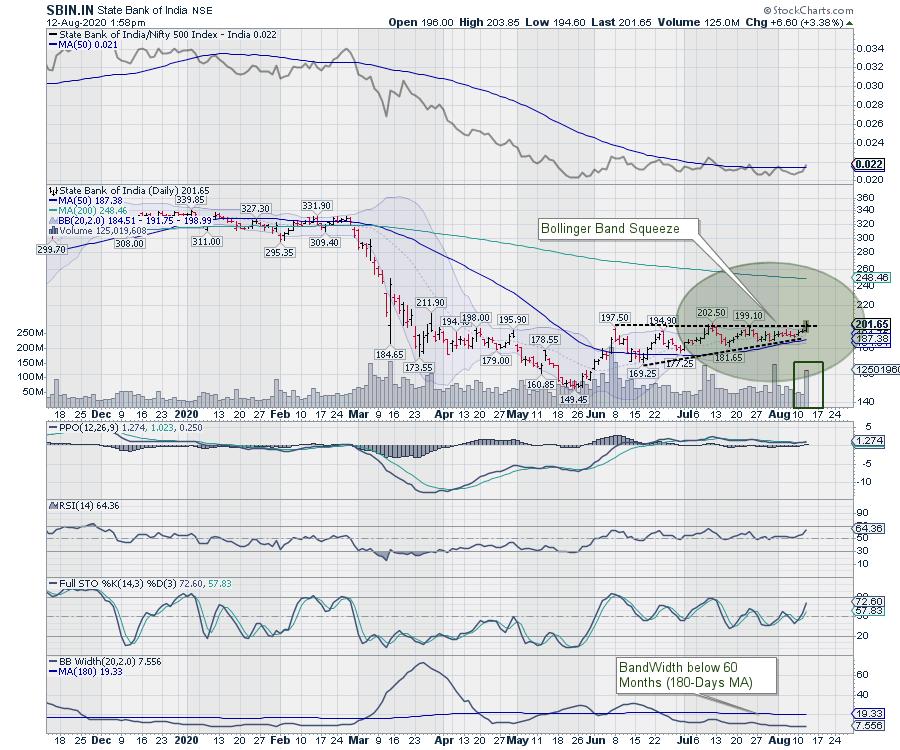
SBIN.in (State Bank Of India)

SBI.in has seen a prolonged period of low volatility over the past several weeks, which has led to contraction of the Bollinger bands. Periods of low volatility are often followed by the periods of high volatility. The probability of the sharp move in price increases the longer price remains in such a contracted range.
The Bollinger Bandwidth was at its lowest over the past six months; rules well below the 6-month or a 180-day Moving Average. Throughout this squeeze playing out, the On Balance Volume (OBV) has been in a rising trajectory. Also, a small bullish ascending triangle is observed as well.
The prices appear to be breaking out from the squeeze. If the present technical setup resolves in the intended direction, the stock may test the 218-224 levels over the coming days. This reading will lose relevance if the price slips below 184 on a closing basis.
Milan Vaishnav, CMT, MSTA
Consulting Technical Analyst,
www.EquityResearch.asia
