SRF Ltd - SRF.IN

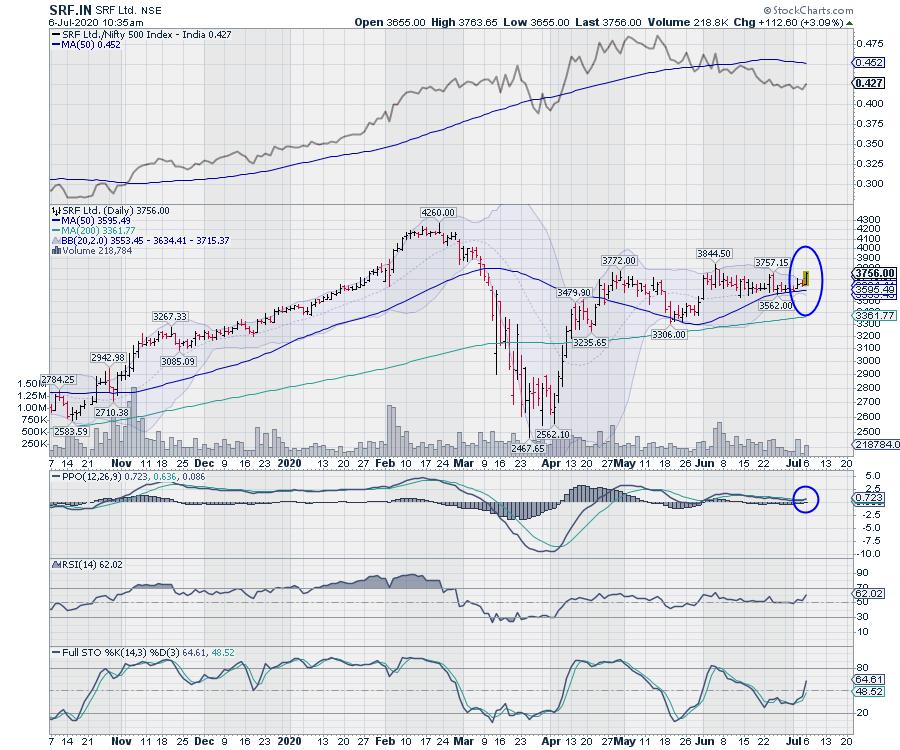
Over the past several weeks, this stock moved in a capped range which has been getting narrower. The price action has formed a bullish ascending triangle and has also resulted in a classic Bollinger Band Squeeze.
Bollinger bands are over 60% narrower than normal. This denotes periods of low volatility, which are always followed by periods of high volatility. The stock has shows a couple of signs that point towards a likely breakout on the upside.
The daily MACD is on the verge of giving a positive crossover. The Weekly MACD has already shown a positive crossover; it is now bullish and trades above its signal line. While the RSI remains neutral and shows no divergence against the price, Stochastic has shown a fresh buy signal. The On Balance Volume (OBV) is moving sideways and does not show any kind of divergence against the price movement.
If the present squeeze gets resolved in the intended direction, the stock may test 3950-4000 levels. Any move below 3450 shall negate this view.
Milan Vaishnav, CMT, MSTA
Consulting Technical Analyst
Disclosure pursuant to Clause 19 of SEBI (Research Analysts) Regulations 2014: Analyst, Family Members or his Associates holds no financial interest below 1% or higher than 1% and has not received any compensation from the Companies discussed.
