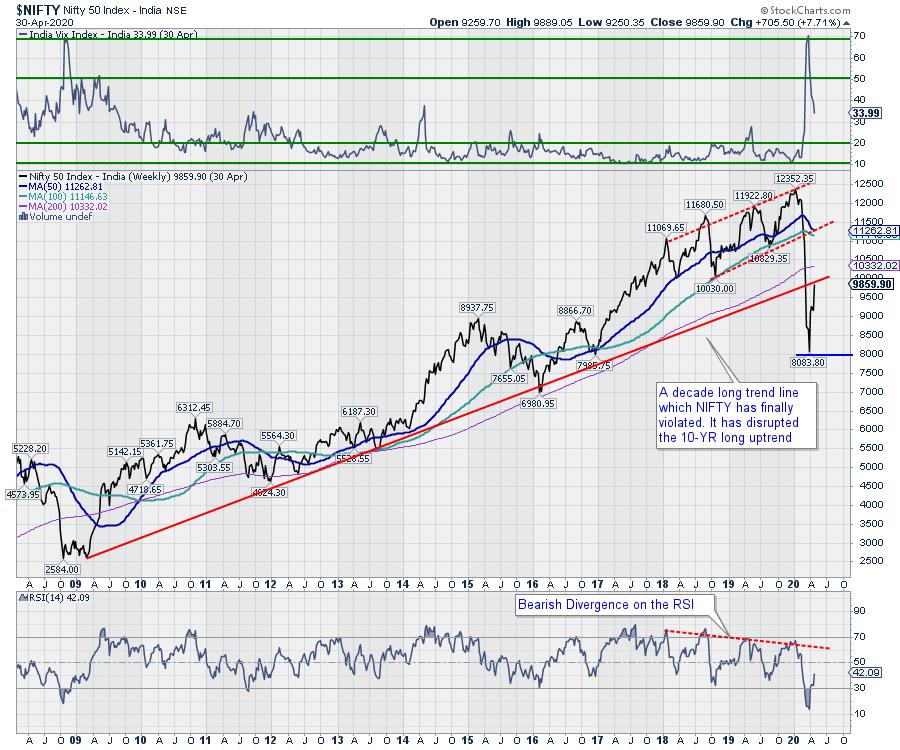
The previous week saw the markets trading on a much better-than-expected note as the headline index continued to surge higher, ending with strong gains. The markets had seen a loss of momentum in the week before this one; however, the truncated week saw the resumption of the technical rebound, which took the markets higher. This week, the NIFTY went on to pile up some more gains, ending just below the very strong and crucial resistance point. The headline index has ended, putting on 705.50 points (7.71%) on a weekly basis.

The week will begin on a weaker note this Monday as the NIFTY adjusts to a weak global setup, as the domestic markets did not trade on Friday. If we assign a crucial technical reason for this, the Index has halted precisely at the decade-old upward rising trend line that it had violated. Such strong support, once broken, is now expected to be an equally solid resistance point going ahead. The India Volatility Index (INDIAVIX) eased further this week by 13.11% to 33.99.
With a weak start expected on Monday, the levels of 9700 and 9830 are expected to act as strong resistance points throughout the week. The supports will come in at 9610 and 9325 levels. Corrective moves, if any, are expected to make the trading range broader than usual.
The Relative Strength Index (RSI) on the weekly chart is 42.09; it remains neutral and does not show any divergence against the price. The weekly MACD is bearish as it trades below its signal line. The PPO is negative. A long white body appeared on the candles; it represents the consensus of the market participants on the upside throughout the week.
The pattern analysis shows that, after pulling back from the lows that were formed in March, the NIFTY has closed just at the upward rising trend line. This decade-old upward rising trendline is the one that the Index had violated in March on the downside, which had resulted in disruption in the primary uptrend. With a gap down opening expected on Monday, the credibility of this trend line as a pattern resistance will be reinforced.
The markets are currently placed at a critical juncture on the weekly charts. After the expected negative opening, if the NIFTY fails to move past the 9860 levels, then this level may end up becoming a lower top for the Index on the weekly chart. The behavior of the NIFTY against the price level in the coming week will have technical significance going ahead. The NIFTY's failure to move past 9860 on a closing basis will reinforce the credibility of the decade-old trend line as a solid resistance, as well as mark 9860 as a lower top for the markets on a weekly closing basis.
We recommend continuing to stay away from making aggressive purchases even if the markets show some lower-than-current levels. We also recommend continuing to say highly stock-specific and adopt a defensive approach for the coming week.
Sector Analysis for the Coming Week
In our look at Relative Rotation Graphs®, we compared various sectors against CNX500 (NIFTY 500 Index), which represents over 95% of the free float market cap of all the stocks listed.


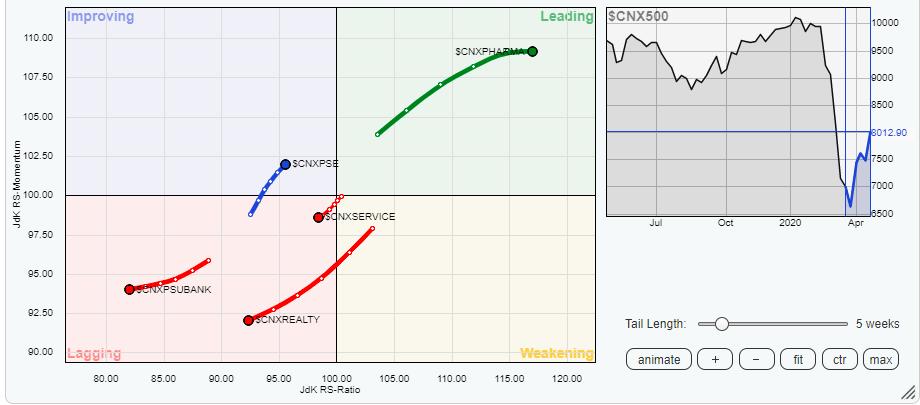
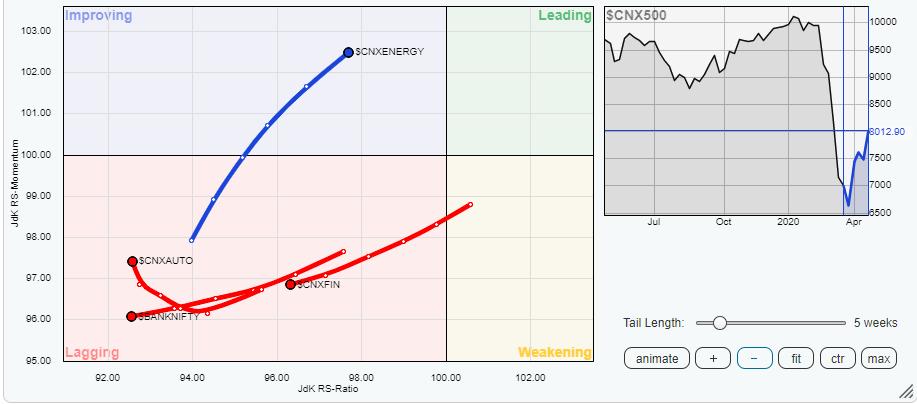
The review of Relative Rotation Graphs (RRG) shows that the NIFTY PSE Index has crawled further in the improving quadrant, along with NIFTY Energy Index. These two groups are likely to put up a stock-specific outperformance against the broader NIFTY500 Index.
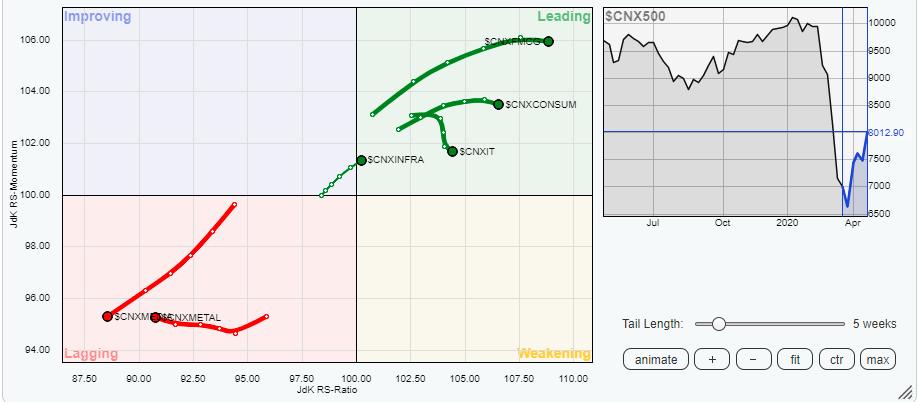
The NIFTY Infrastructure Index has moved in the leading quadrant. The Pharma, FMCG and Consumption Index are also firmly placed in the leading quadrant. These groups will collectively outperform the broader markets relatively. The IT Index also remains in the top quadrant, but appears to be faltering on its relative momentum.
The NIFTY Commodities look to be just short of entering the improving quadrant. However, this group has not yet completed its bottoming-out process. The Auto Index is seen attempting to consolidate as well, but it is far from getting bottomed out.
The Financial Services, BankNIFTY, PSU banks, Services Media, Metals and Realty Indexes appear to be continuing to languish in the lagging quadrant. They may put up gross relative underperformance against the broader markets in the coming week.
Important Note: RRG™ charts show the relative strength and momentum for a group of stocks. In the above chart, they show relative performance against NIFTY500 Index (Broader Markets) and should not be used directly as buy or sell signals.
Milan Vaishnav, CMT, MSTA
Consulting Technical Analyst
