The global equity markets have seen the mother of all volatile times during the first five-and-a-half months of the year 2020. From the peak of early 2020, the key equity markets saw a sharp decline of over 35% in most cases. Following those lows, the stocks have also managed to recoup around 30% of all gains. The volatility indexes have seen their lifetime highs during this year, and have also seen retracement of over 70% from their respective peaks.
On the domestic front, the most prominent part of the trading fabric has been the NIFTY ending its multi-year underperformance against the BankNifty. Until today, since their introduction in the early 2000s, the BankNifty has always relatively outperformed the NIFTY on a strong note.

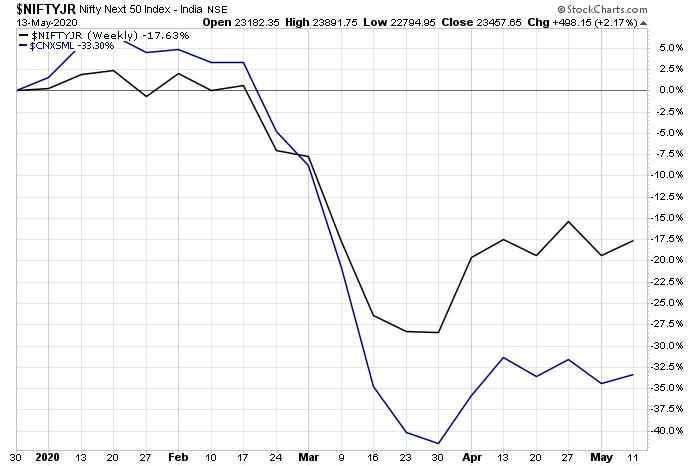
Another noteworthy technical setup is between the Small Caps and the NIFTY Next 50 Index. If we evaluate the year-to-date performance, the NIFTY Next 50 has given negative returns of -18.66%. The Small-Cap 100 Index has provided negative returns of -34.93%.
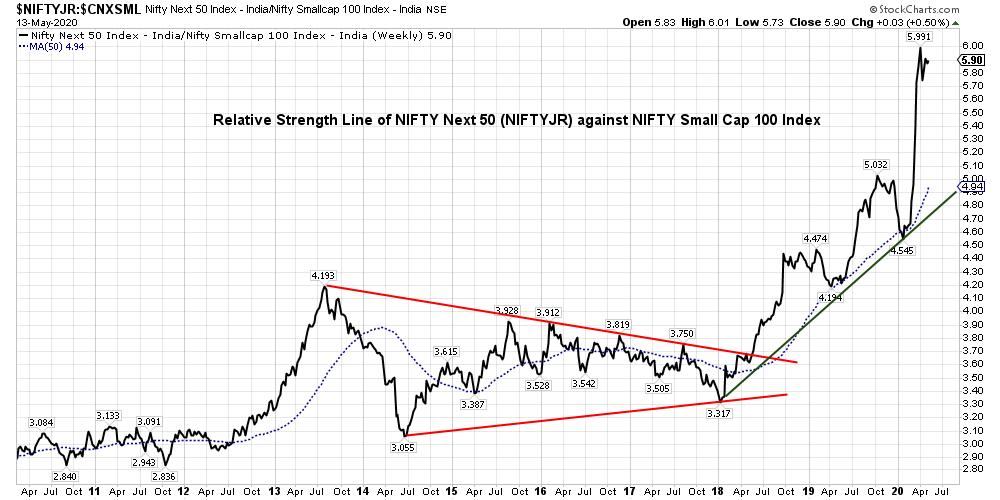
In the given circumstance, it makes more sense to search for trading opportunities in the NIFTY Next 50 Stocks than in the small-cap space. The below chart is the Relative Strength Line of NIFTY Next 50 against the small-cap. It shows that the NIFTY Next 50 ended its multi-month underperformance in May 2018 and, since then, has strongly outperformed the small-cap space on a relative basis.

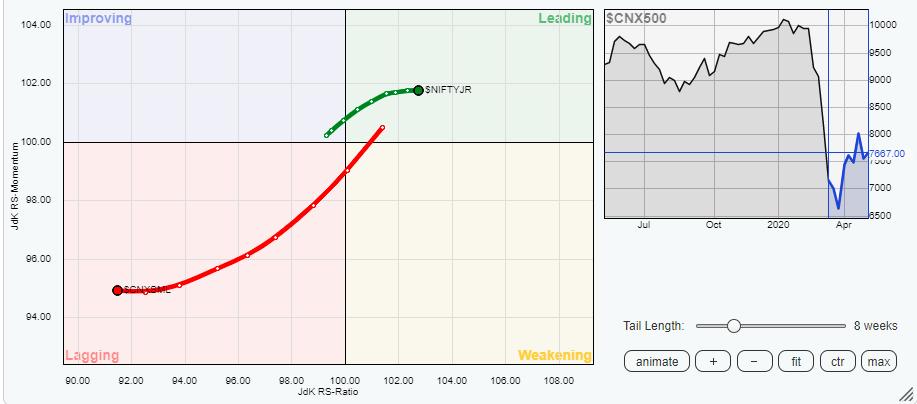
This technical view is also corroborated with the placement of these two indexes on the Relative Rotation Graph (RRG).

When compared against the broader NIFTY 500 Index, it is reasonably evident that, while the NIFTY Next 50 is placed firmly in the leading quadrant of the RRG Chart, the Small-Cap 100 index is seen languishing in the lagging quadrant.
It would, therefore, make more sense to scout for opportunities in the NIFTY Next 50 space as compared to the small-cap universe.
Milan Vaishnav, CMT, MSTA
Consulting Technical Analyst,
