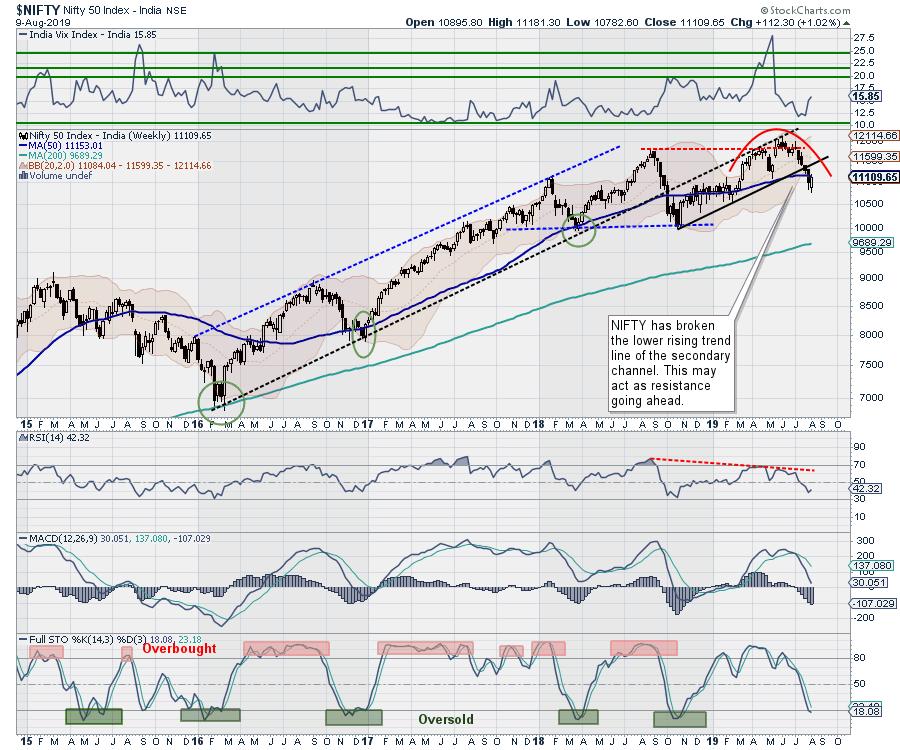
After bouncing off its 100-Week MA in the previous week, the markets attempted to take a breather and stabilize during the past week. The NIFTY was able to bounce back once again from the 100-Week MA; this pullback was aided by the oversold nature of the markets on the short-term charts. After an initial slip, the NIFTY kept its head above the 100-Week MA, which is presently at 10861 and ended with weekly gains of 112.30 points (+1.02%).
The coming week is just a 3-day working week, which is further fragmented by holidays, as the 12th and 15th of August are trading holidays on account of Eid and Independence Day respectively. The coming week is expected to see the markets consolidating in a range-bound way without making much headway on either side; they will likely oscillate between the 50-Week and 100-Week MA.
The short-term technical charts have seen the NIFTY bouncing back 250-odd points from the recent lows. However, the higher-timeframe charts confirm and show that this may be just a technical pullback and not a reversal of trend, which will require confirmation over the coming days.
The coming week will see the levels of 11180 and 11250 acting as resistance while supports come in at 11910 and 11800.
The weekly RSI is 42.3355; it remains neutral and does not show any divergence against the price. The MACD is still bearish and trading below its signal line. A white body occurred on the candles; its emergence near the support area of the 100-Week MA lends mild credibility to the support area represented by this MA.
The pattern analysis makes it evident that the NIFTY had a technical pullback given the oversold condition on the short-term charts. The Index had breached the secondary rising channel on the higher-time-frame charts; a similar pullback was witnessed on the weekly charts as well.
The markets are not expected to make any significant directional move given the truncated and short week. A range-bound oscillation is more likely, and we will see some sector-specific defensive play unfolding in the markets. The reversal that we saw in the previous two sessions could be a mere technical pullback; it would be prudent to wait for a temporary confirmation of a bottom before building up any larger directional bets.
Sector Analysis for the Coming Week
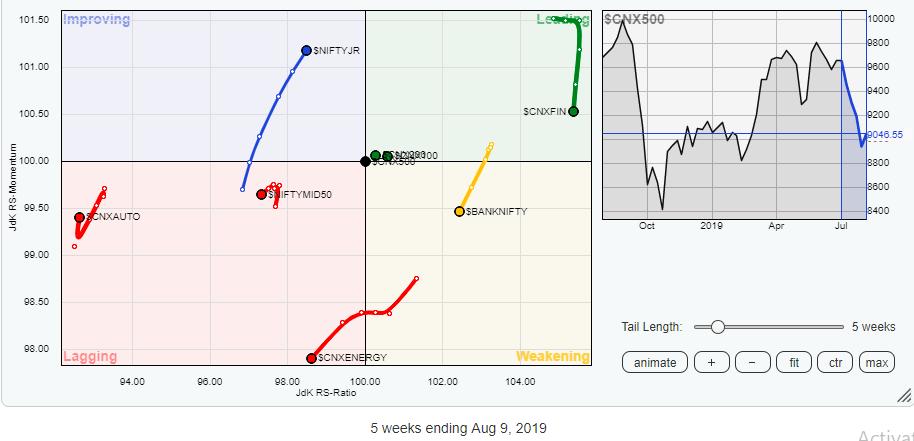
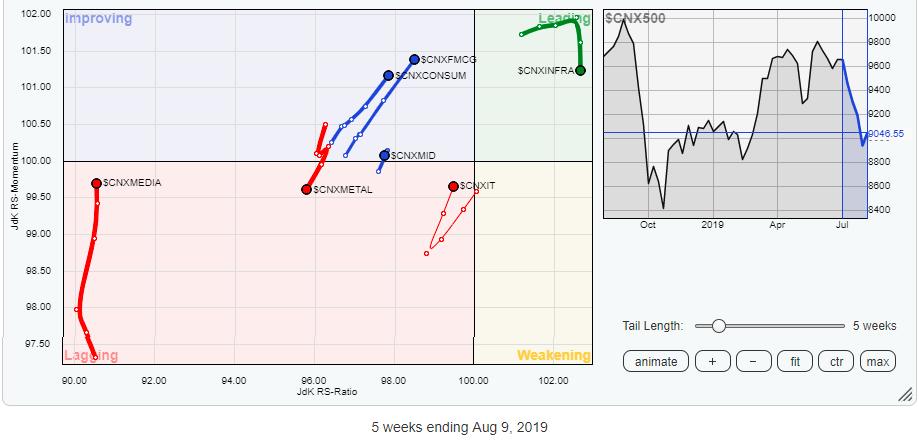
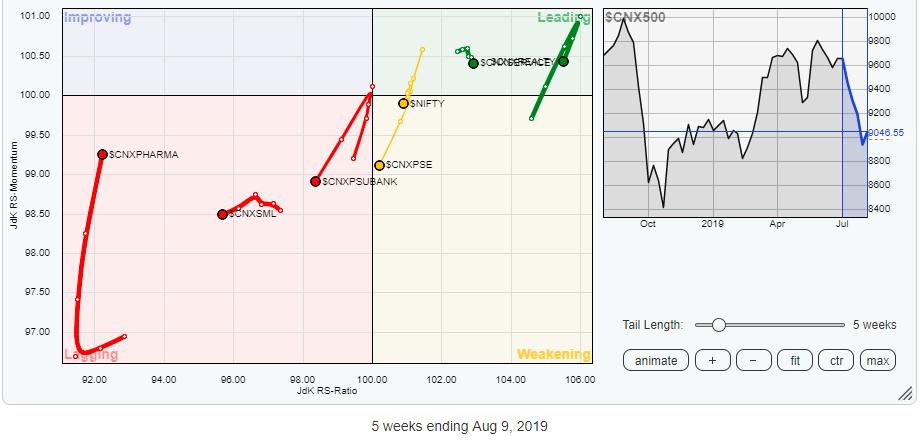
In our look at Relative Rotation Graphs, we compared various sectors against CNX500 (NIFTY 500 Index), which represents over 95% of the free float market cap of all the stocks listed.


Our review of Relative Rotation Graphs (RRG) reflects a defensive setup in the markets. Despite remaining in the leading quadrant, the Realty, Services Sector, Infrastructure and Financial Services Indexes are seen sharply giving up on their relative momentum when compared to the broader markets, namely the NIFTY 500 index.
Giving them company in loss of relative momentum are the BankNIFTY, NIFTY MID50, Auto, Metal, CPSE, PSE and PSU Bank Indexes while being placed at different places on the RRG. All these indexes are seen slowing down.
We will see relative out-performance compared to the broader markets from FMCG and Consumption stocks, which are seen steadily building and improving their relative momentum. The IT pack is also sustaining its upturn and experiencing a sharp improvement in its relative momentum. Some sporadic and isolated stock-specific performance can also be expected from the Media and Pharma groups.
Important Note: RRG™ charts show you the relative strength and momentum for a group of stocks. In the above chart, they show relative performance against NIFTY500 Index (Broader Markets) and should not be used directly as buy or sell signals.
Milan Vaishnav, CMT, MSTA
Consulting Technical Analyst,
