The Indian equity markets finished one their most eventful weeks as they faced the general election results. Though the move remained much on expected lines, the timing got little awry as the market finished the bulk of its reaction by rising after the exit polls rather than waiting for the election results. The election results saw both NIFTY and the Sensex testing their own historically high levels, followed by a retracement on account of profit-taking. Following an extensively wide-ranging trading week, the headline index NIFTY finally settled with net gains of 436.95 points (+3.83%).
Despite the markets moving all over the place during the week, the charts show that there were relatively less obscure moves on the weekly charts. The noise levels on the longer-timeframe charts were much lower compared to the daily charts. The reason behind this market behavior was that the reaction to the general election outcome was very measured and on expected lines.
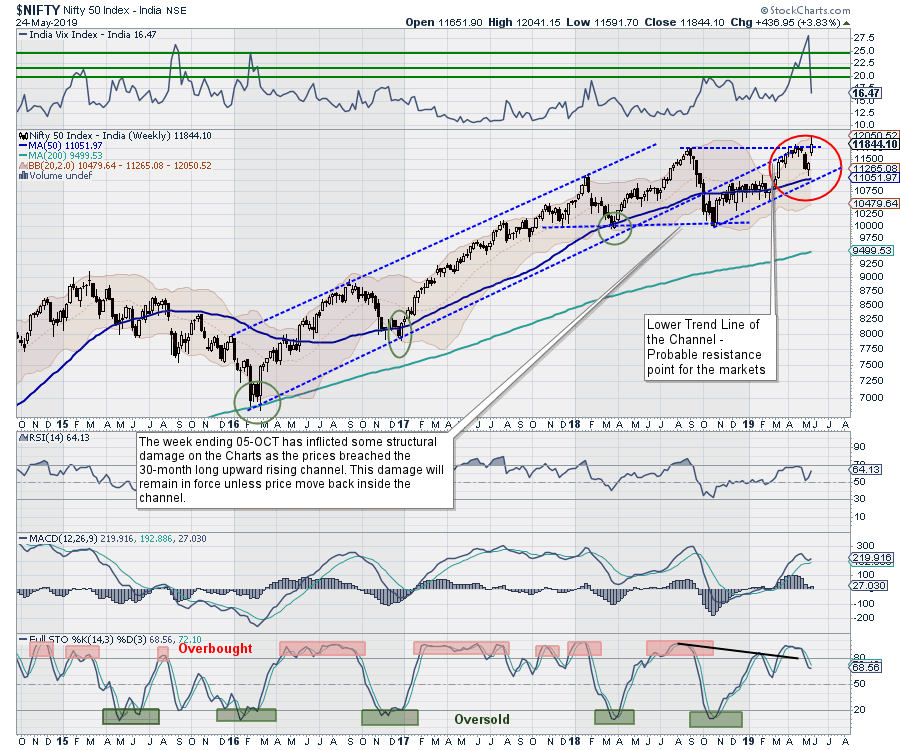
Another significant technical development that occurred during the week is the sharp fall in VIX. The market reaction to the election results was so measured, unanimous and without any tug-of-war between market participants that it saw the India VIX declining by 41.34% to 16.47. That the reaction to the election results was measured and unanimous is illustrated on the charts, as the NIFTY remained well within the secondary channel and has not violated any of the levels on either side.
We expect a steady start to the coming week, which will continue seeing the markets digest the political outcome. The trading range is expected to remain wider, with the levels of 11930 and 12050 set to act as immediate resistance points. Supports, on the other hand, will come in at 11600 and 11510.
The weekly RSI stands at 64.1270 and shows a bearish divergence against the price, as the RSI has not marked a fresh 14-period high while the NIFTY did so. The weekly MACD remains bullish while trading above its signal line. A rising window occurred on candles. The formation of a rising window results out of a gap, which is a possible continuation of the uptrend.
The pattern analysis does not show any unusual moves on the chart. The NIFTY continues to trade in the secondary channel that it had formed after breaching the primary upward rising channel in October 2018. The lower trend line of this primary channel will continue to provide resistance to the NIFTY going forward.
Even though the volatility declined over the past week, we expect it to resurface again, albeit on a moderate level. Markets are likely to turn highly selective and somewhat volatile. We recommend adopting a judiciously selective approach while selecting stocks and to continue protecting profits at a higher level.
Sector Analysis for the Coming Week
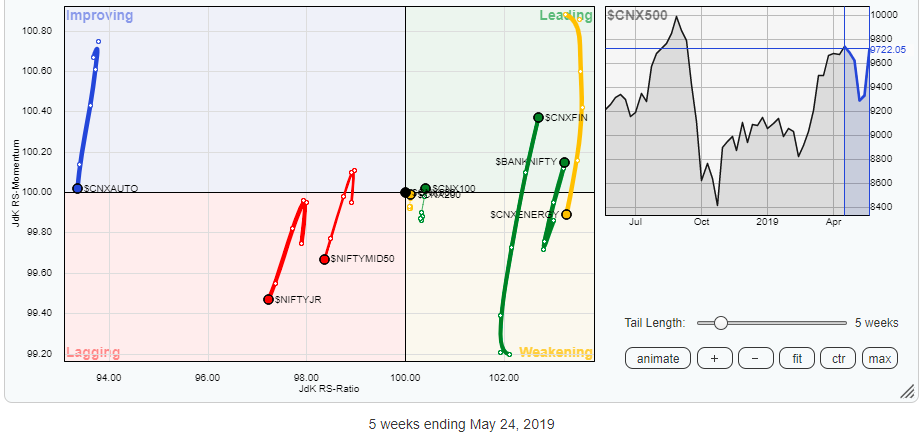
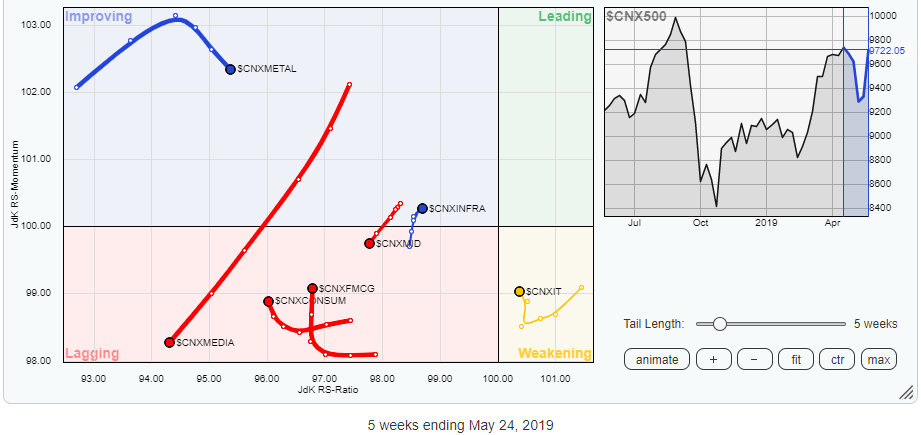
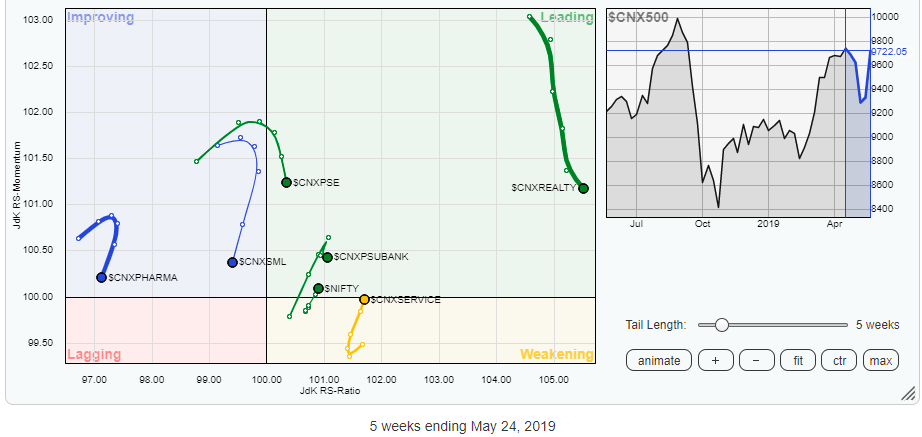
In our look at Relative Rotation Graphs, we compared various sectors against CNX500, which represents over 95% of the free float market cap of all the stocks listed.


Our review of Relative Rotation Graphs (RRG) shows that the financial services index and the BankNifty have shown a sharp improvement in their relative momentum and have moved in the leading quadrant. These groups, along with the Services sector index, are likely to relatively outperform the broader markets.
The PSU banks also remain in the leading quadrant, but their momentum appears to be stalling after a good rise over the past several weeks. The Infrastructure Index remains in the improving quadrant and is seen improving its relative momentum as well. A sharp decline in momentum is observed in the Media, Pharma, small-cap, NIFTY Jr, mid-cap and Auto indexes. These indexes may not see any significant out-performance against the broader markets. The FMCG and Consumption indexes can be seen trying to consolidate their performance. Some stock-specific performance may be expected from these packs.
Important Note: RRG™ charts show you the relative strength and momentum for a group of stocks. In the above chart, they show relative performance as against the NIFTY500 Index (Broader Markets) and should not be used directly as buy or sell signals.
Milan Vaishnav, CMT, MSTA
Consulting Technical Analyst
www.EquityResearch.asia

