TAKEAWAYS
- Gold and silver are on the verge of breaking out toward record highs
- Gold and silver have reached most analyst price targets, but they could rise further
- From a technical perspective, gold and silver prices could smash above resistance levels

Gold is on the verge of breaking into all-time high territory, and silver is poised to challenge its four-year highs. Both metals are rallying, and it seems probable that both assets will rise above the current threshold levels.
Supposing they do, what's next?
In terms of analyst price forecasts, most consensus targets for 2024 have already been reached, well ahead of schedule. From a technical standpoint, both metals could trend higher, disregarding any potential short-term dip. However, what economic factors might be driving this trend?
The World Bank Predicts an 8% Rise in Gold and 7% Rise in Silver
According to the World Gold Council, central banks worldwide bought nearly 300 tonnes of gold in the first quarter alone in 2024. Although data on silver purchases is hard to come by, the Silver Institute expects total industrial demand for silver to reach a record of 690 million ounces in 2024, not counting investment demand (as silver is also a "monetary" metal).
Overall, several factors are expected to drive both metals higher:
- Heightened geopolitical tensions.
- Central banks' gold purchases as a hedge against economic instability and currency depreciation.
- Persistently high inflation rates and expectations of lower interest rates.
- Rising industrial demand for silver, particularly in light of solar energy project expansion.
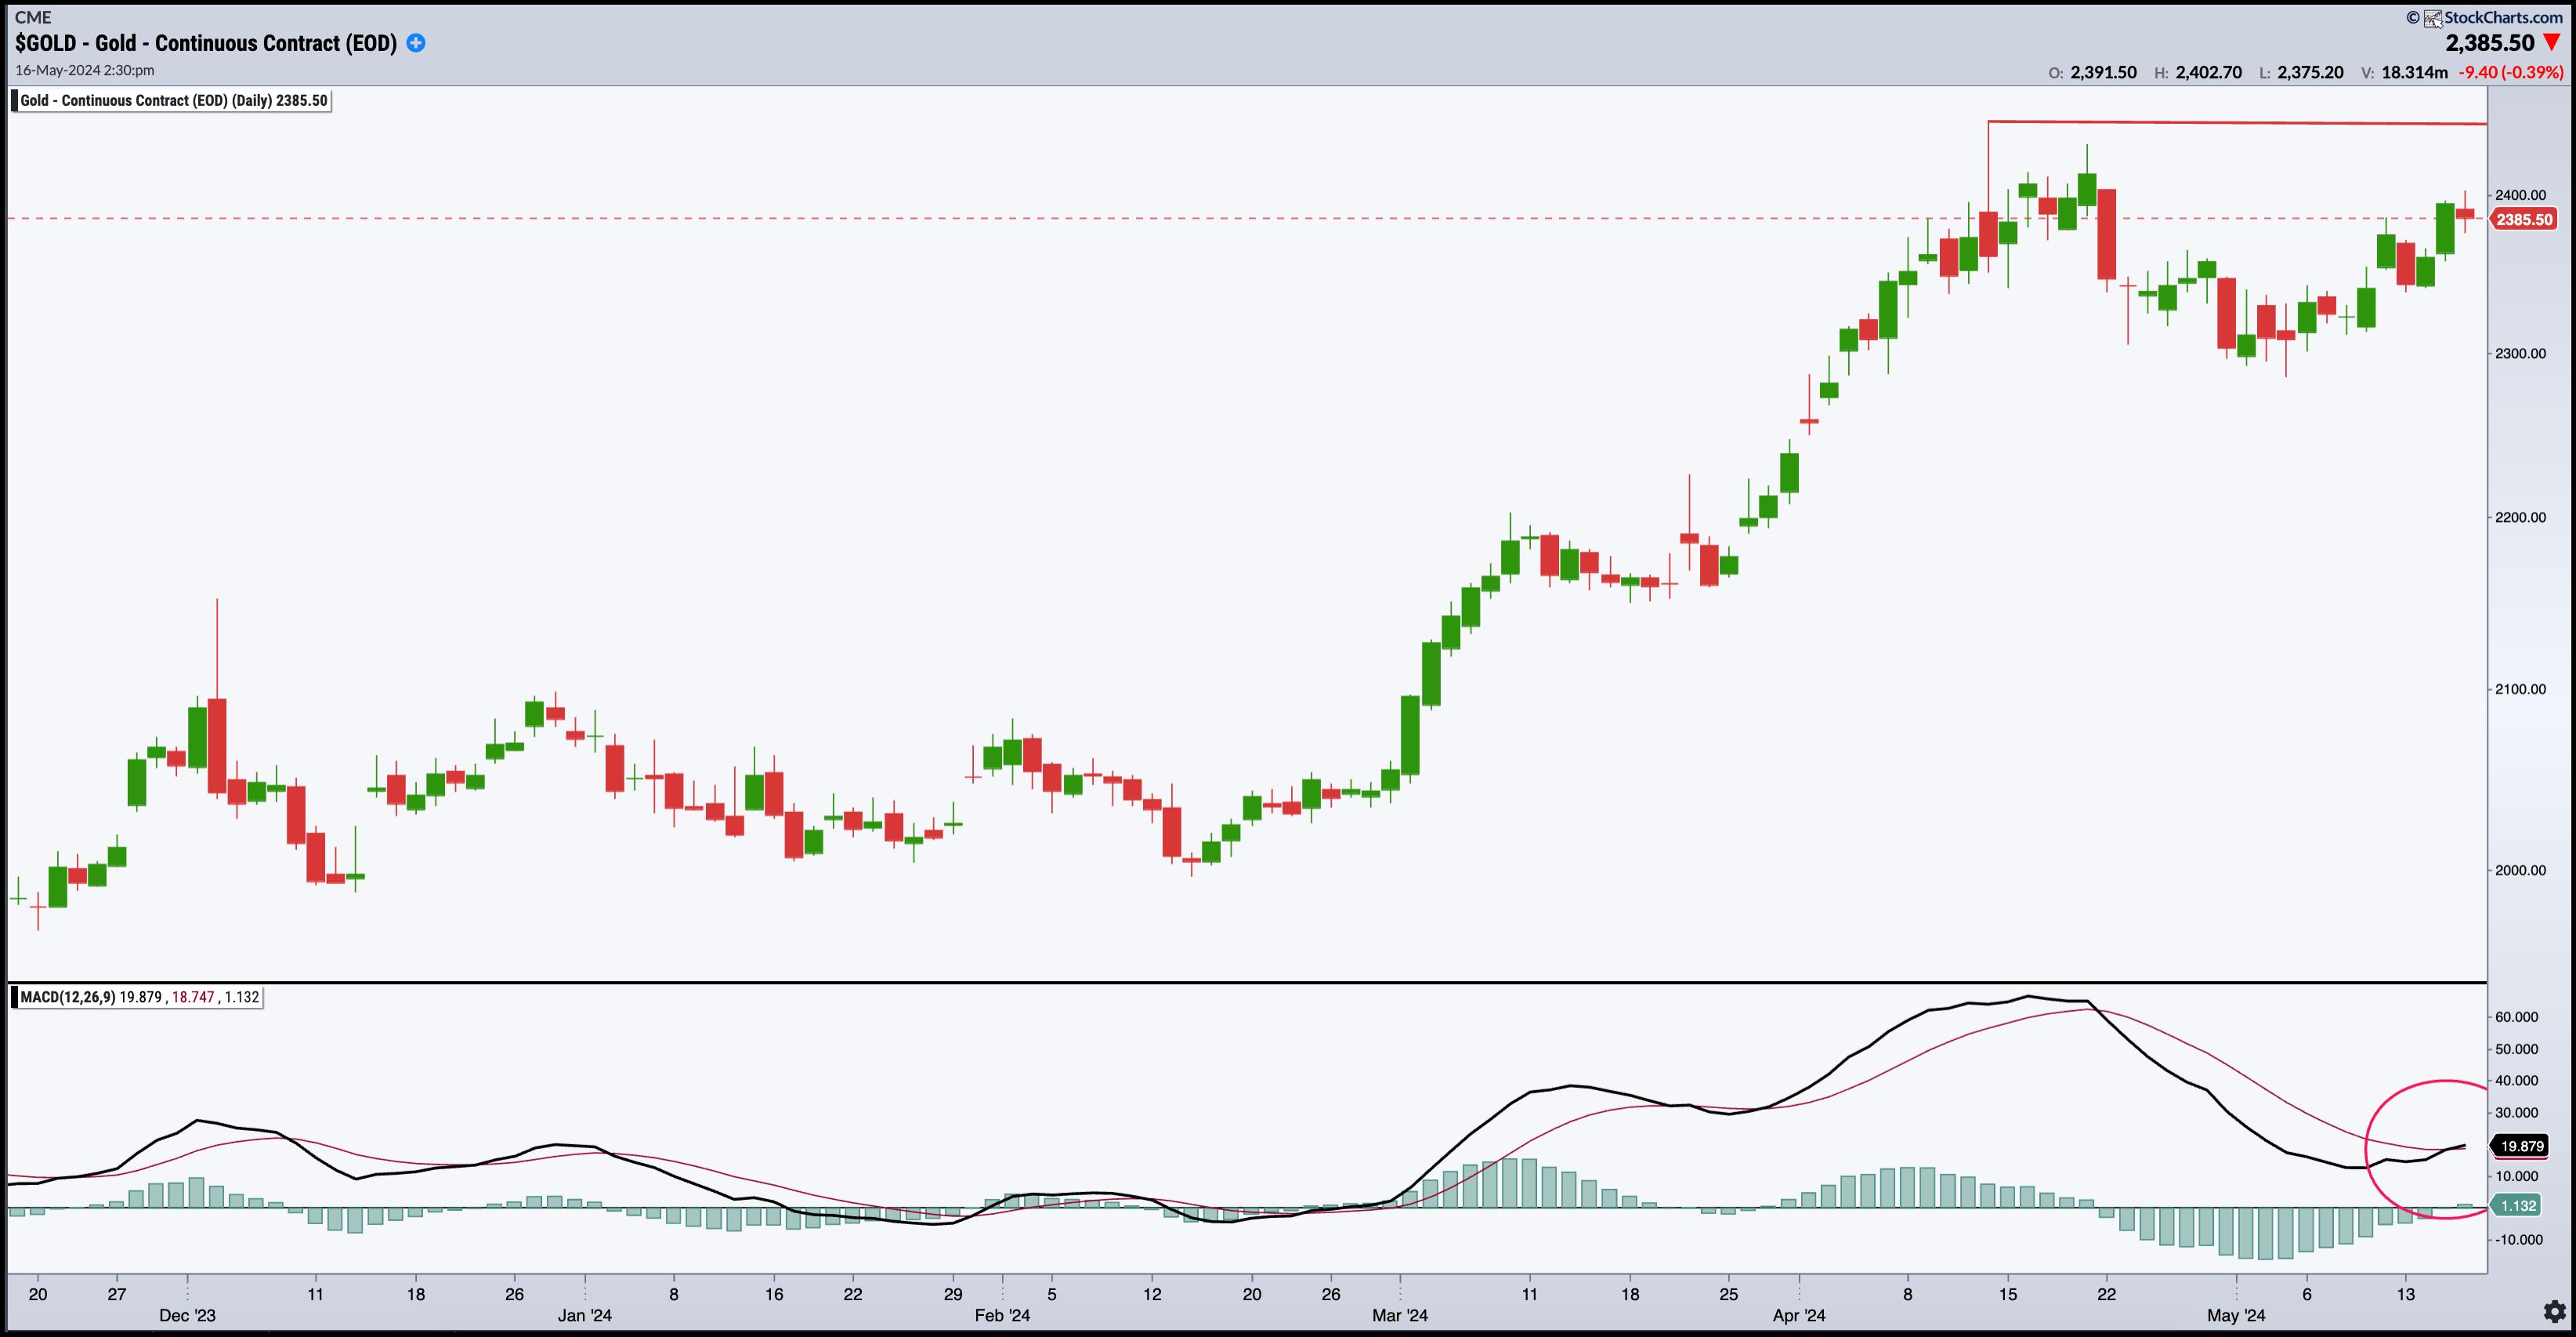
So, what might this look like in terms of today's charts? CHART 1. DAILY CHART OF $GOLD. Gold is gaining momentum as it approaches record-high territory.Chart source: StockChartsACP. For educational purposes.
Looking at gold ($GOLD), watch the resistance level at $2,448.80 (see red line); a break above this price marks an all-time high for the yellow metal. Note that the Moving Average Convergence Divergence (MACD) line is about to cross over the signal line, and the histogram is about to rise above the centerline, both indicating bullish momentum.
The dotted blue line at the $2,585 range approximates the World Bank's 8% price target. If you follow gold news, you're probably aware that a few analysts predict gold prices will exceed this level. However, the higher levels depend on geopolitical variables, which, although conceivable, are too distant to be certain (at least for now).

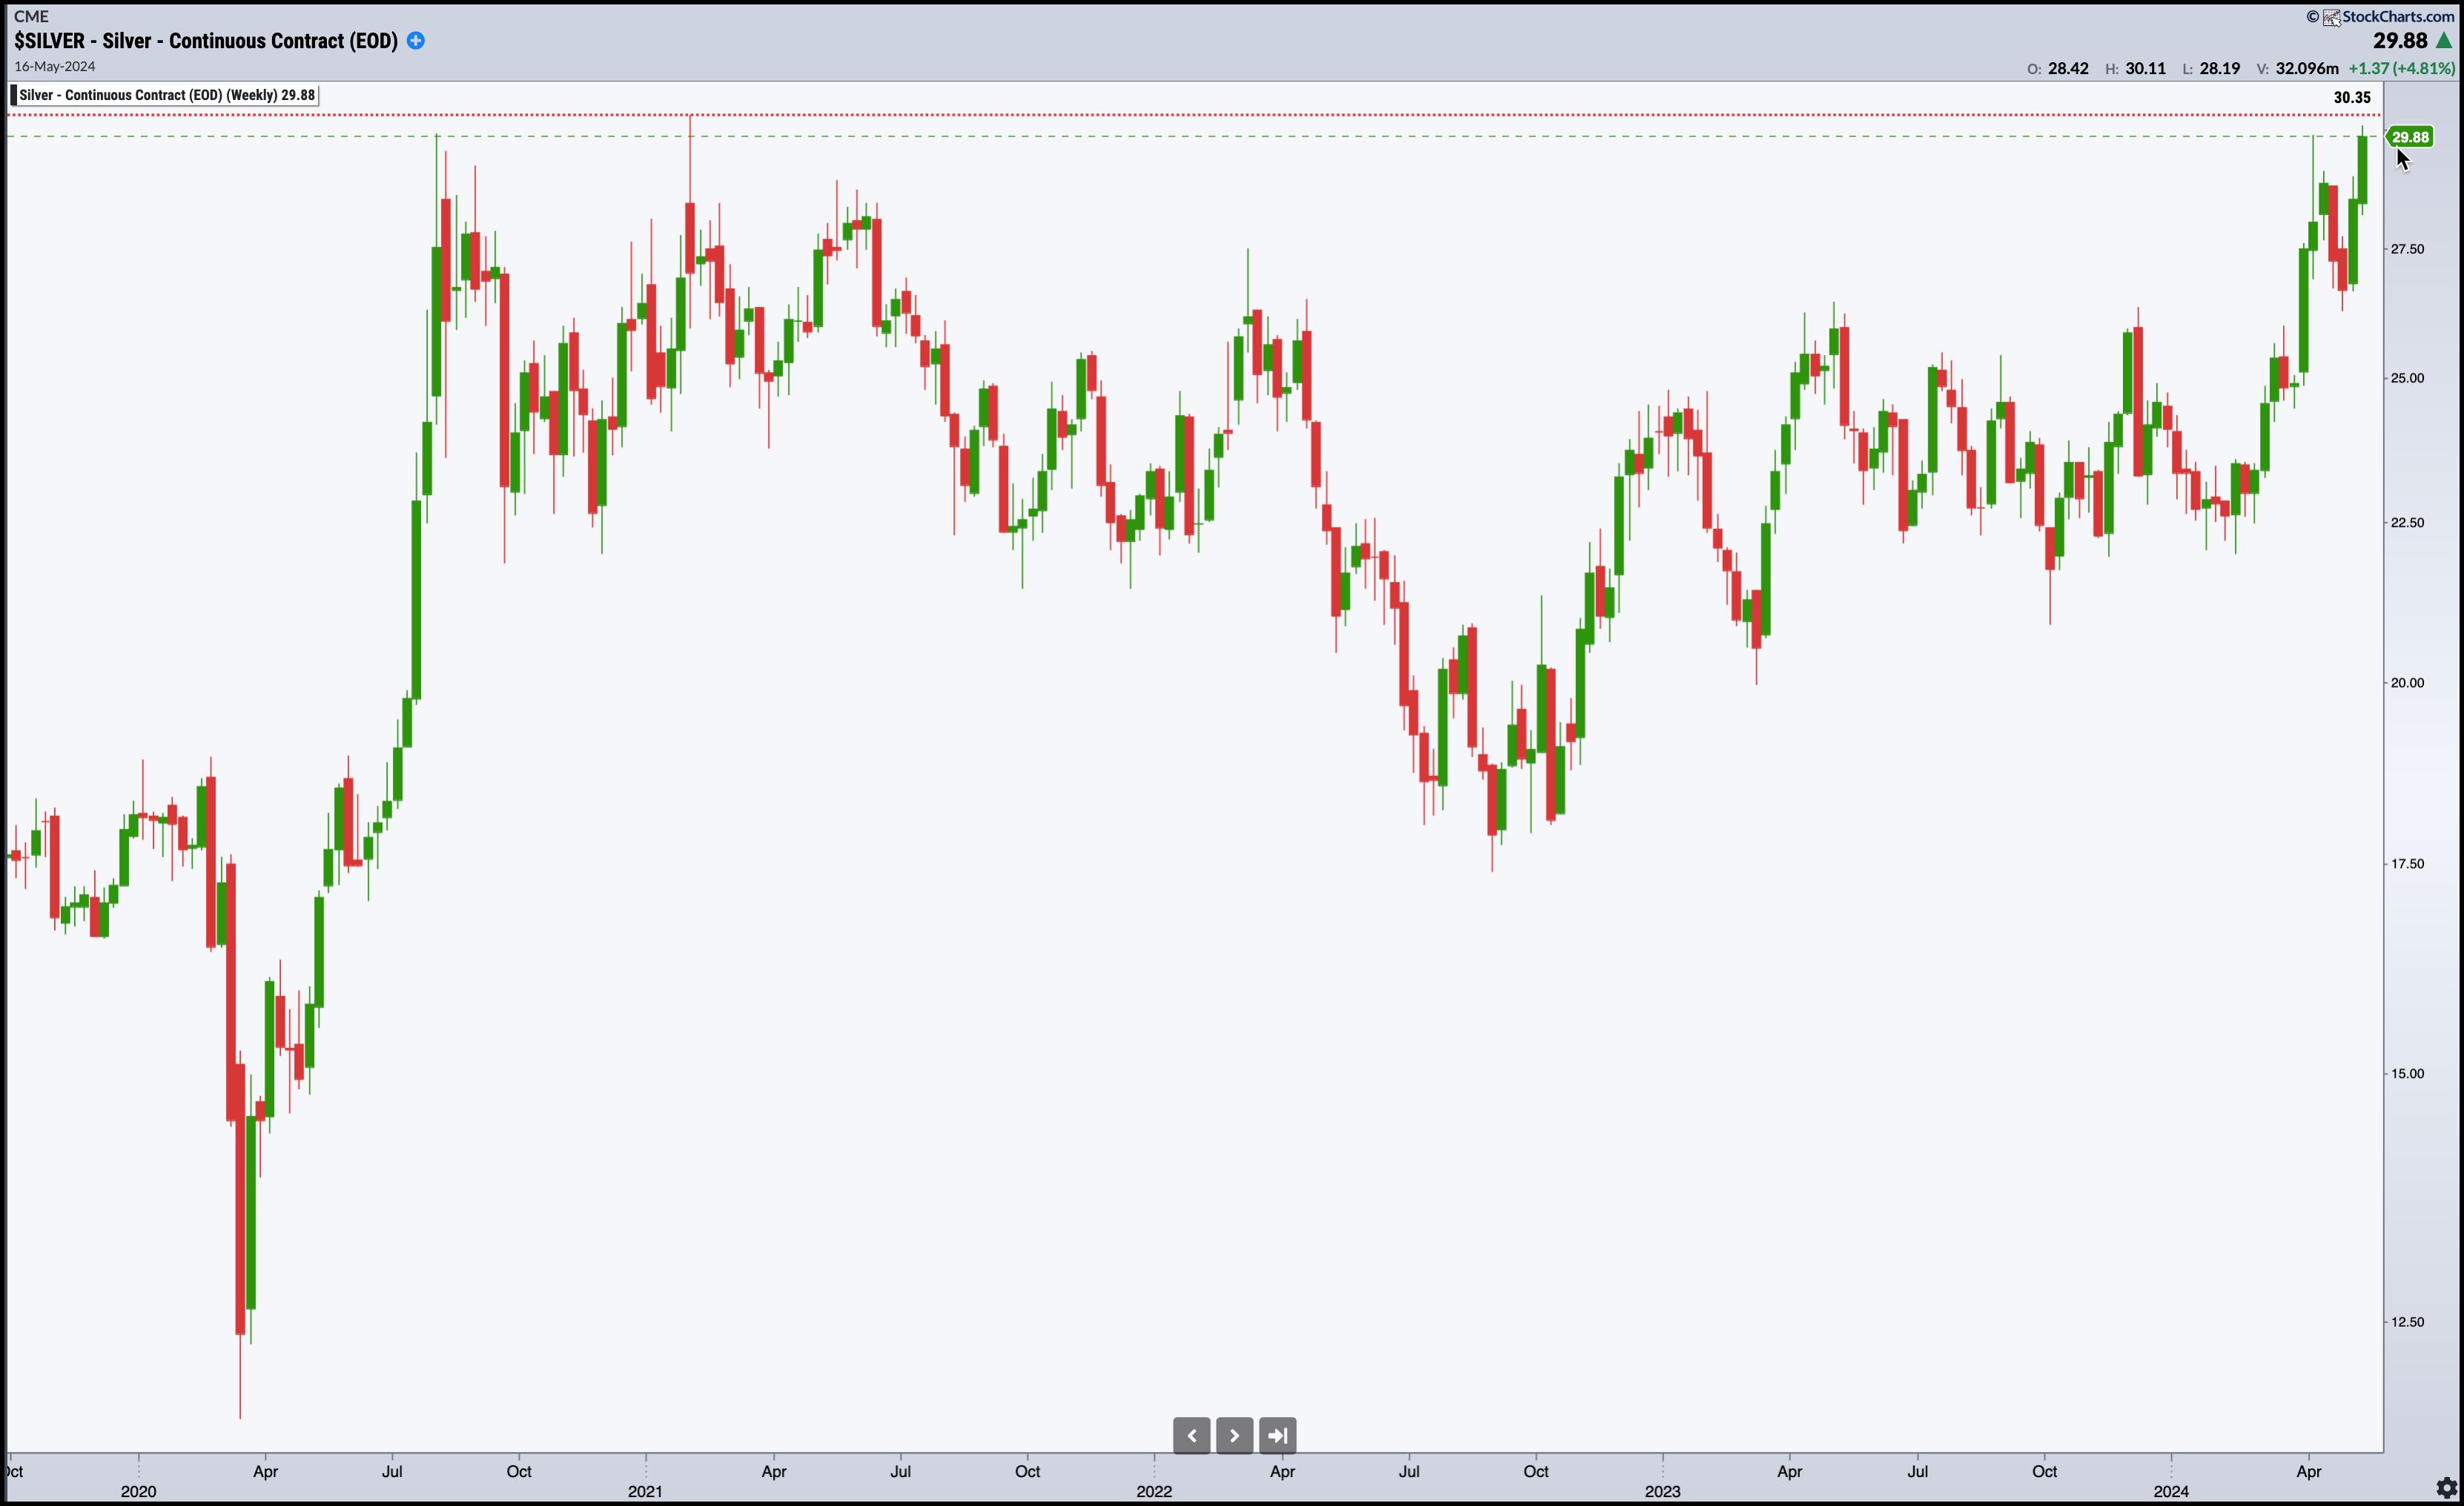
CHART 2. WEEKLY CHART OF $SILVER. Can silver's price increase break through its two significant technical challenges? Chart source: StockCharts.com. For educational purposes.
JPMorgan, Commerzbank, and Citigroup set their silver price targets to $30, which the metal had reached on Thursday. Silver is just a few points away from challenging its four-year high at $30.35. Above that, you can see an approximation of the World Bank's 7% target at the $31.80 range.
Could silver reach its 2011 highs—the $50 per ounce range? A few analysts maintain that target, but, considering the now-tempered expectations of aggressive rate cuts by the Federal Reserve, especially following the latest Consumer Price Index (CPI) and Producer Price Index (PPI) readings, several analysts who had previously set higher targets for silver have now revised them lower.
But if silver has a reputation for volatility, it's because the factors driving its price as a monetary and industrial metal are also subject to volatility. Just look at how analysts have underestimated the timing of the price forecasts and the now-downward revision of silver's price target.
The Takeaway

If you've followed gold and silver price forecasts over the last year, you might have noticed how targets have adjusted in response to incoming economic data (particularly inflation data), Fed rate cut expectations, and geopolitical factors. Gold negatively reflects the erosion of purchasing power and dwindling sentiment in monetary policy. Silver does, too, to a certain extent, but it's also driven by industrial demand. So, if you're a gold or silver bug, it's important to consider all of these developments—technical levels, dynamics in momentum, inflation, geopolitical developments (particularly the BRICS bloc), and industrial supply and demand.
Most importantly, does it make sense to open long positions now? If you're hedging your purchasing power (in light of persistent inflation and global de-dollarization) by allocating a small percentage of your portfolio to gold, it may be. If you're seeking growth driven by silver's industrial consumption (and less so as a safe haven), you should be more skeptical in the near term. But these conditions change; ultimately, it depends on your long-term goals and percentage allocations.
Disclaimer: This blog is for educational purposes only and should not be construed as financial advice. The ideas and strategies should never be used without first assessing your own personal and financial situation, or without consulting a financial professional.
Happy charting!
