Don't Ignore This Chart! March 30, 2023 at 03:19 PM

This is a follow-up to a piece published a week ago on Nvidia's (NVDA) strong run following its stellar earnings report. It follows NVDA's price action, but from another angle, using the lesser-used Ichimoku Cloud indicator... Read More
Don't Ignore This Chart! March 30, 2023 at 12:35 PM

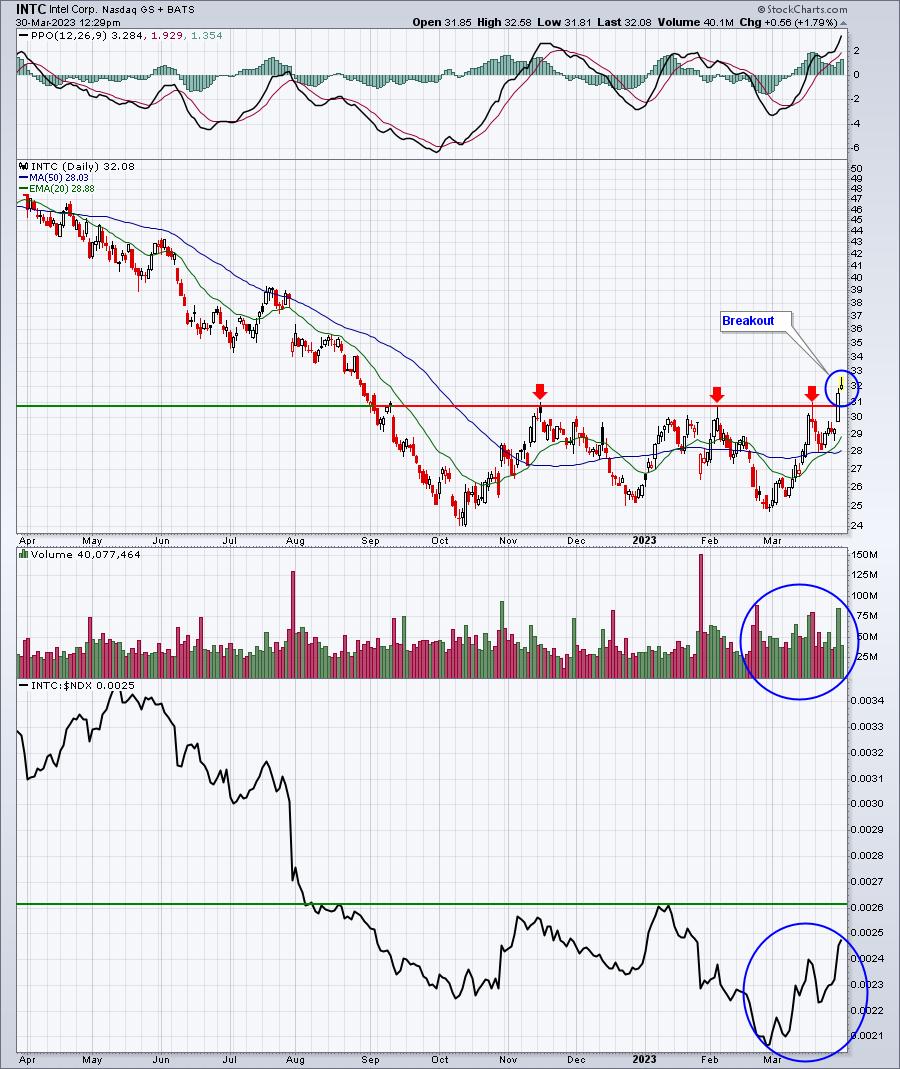
Well, it might be a little early to anoint Intel (INTC) a leader, but there's no denying a significant breakout in the chip stock above key price resistance. On November 15, 2022, INTC opened at 30.72, and the stock hasn't seen an open or close above that level since... Read More
Don't Ignore This Chart! March 24, 2023 at 08:17 AM

Racing ahead of the semiconductor pack, Nvidia (NVDA) appears to be edging toward the upper regions of a parabolic curve. What Does This Mean for NVDA Stock Price? It's a sign of confidence coming off a strong Q4 2022 earnings performance on top and bottom lines... Read More
Don't Ignore This Chart! March 16, 2023 at 01:30 PM

Semiconductors ($DJUSSC) opened 2023 with a BANG! They spent the entire month of February and the first two weeks of March consolidating in a bullish ascending triangle pattern, but today we're either going to get a confirmed breakout or a false breakout... Read More
Don't Ignore This Chart! March 10, 2023 at 02:45 PM
Two big things about Campbell Soup (CPB): First, the company crushed it in earnings last Wednesday. Its second-quarter FY23 results delivered an upside surprise, with an EPS that was 8.37% higher than analysts expected and revenue 2.21% higher than Wall Street estimates... Read More
Don't Ignore This Chart! March 06, 2023 at 07:30 PM

This week's a big one for gold. A steep wave of fear, greed, and data is about to hit the gold market... Read More
Don't Ignore This Chart! March 03, 2023 at 02:41 PM

In the next few days, SMH (VanEck Semiconductor ETF), along with other similar "chip index" funds, may see a strong bounce toward the upside... Read More
Don't Ignore This Chart! March 02, 2023 at 09:22 AM
Target (TGT)'s stock has been bouncing back and forth within a wide eight-month trading range. This happened right after its -44% plunge between April and May last year. Since then, it's been stuck in a $45 range, forming an extremely long rectangle pattern... Read More