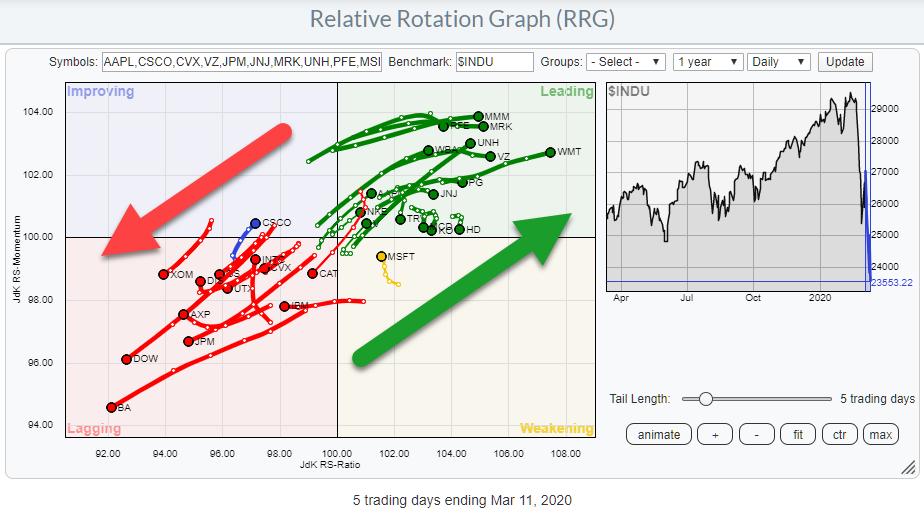
The Relative Rotation Graph for the DJ Industrial constituents shows a clear split between stocks in the leading quadrant vs. stocks inside the lagging quadrant, with only one inside weakening (MSFT) and one inside improving (CSCO).
A few stocks inside the leading quadrant are starting to roll over and a few inside lagging are starting to curl up, but the majority are in pretty well-defined relative trends.
STRONG: WMT, UNH, MRK, VZ, WBA, JNJ, AAPL, V, NKE
WEAK: BA, DOW, JPM, UTX, GS, IBM, CAT
With markets jumping all over the place, down 7% one day and up 5% the next, it is very hard to play any directional trade, at least short-term.
In my weekly Sector Spotlight show I have a segment called "Pair Trade Ideas," where I focus on finding trade setups that are agnostic of general market direction and aim to benefit from the difference in relative strength between two securities.
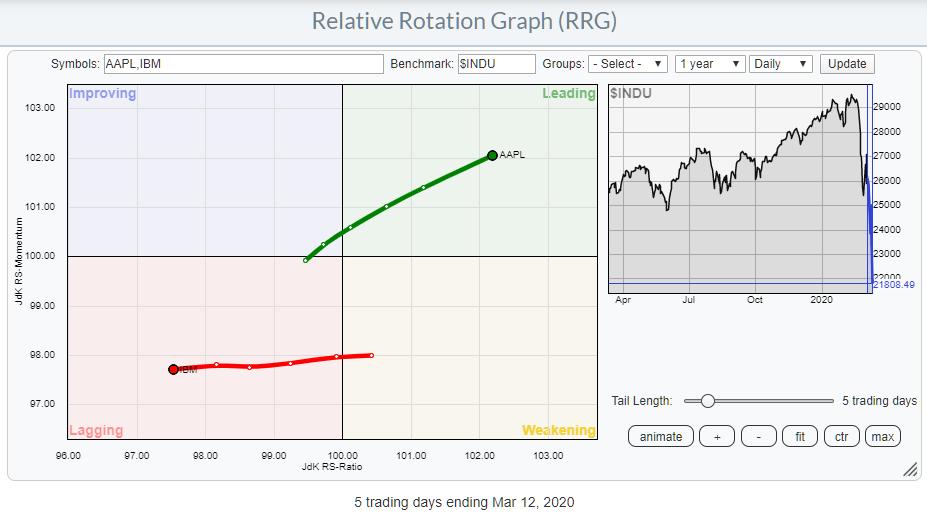
Last Tuesday, I highlighted the AAPL vs. IBM pair. Here are the charts that belong to that pair:


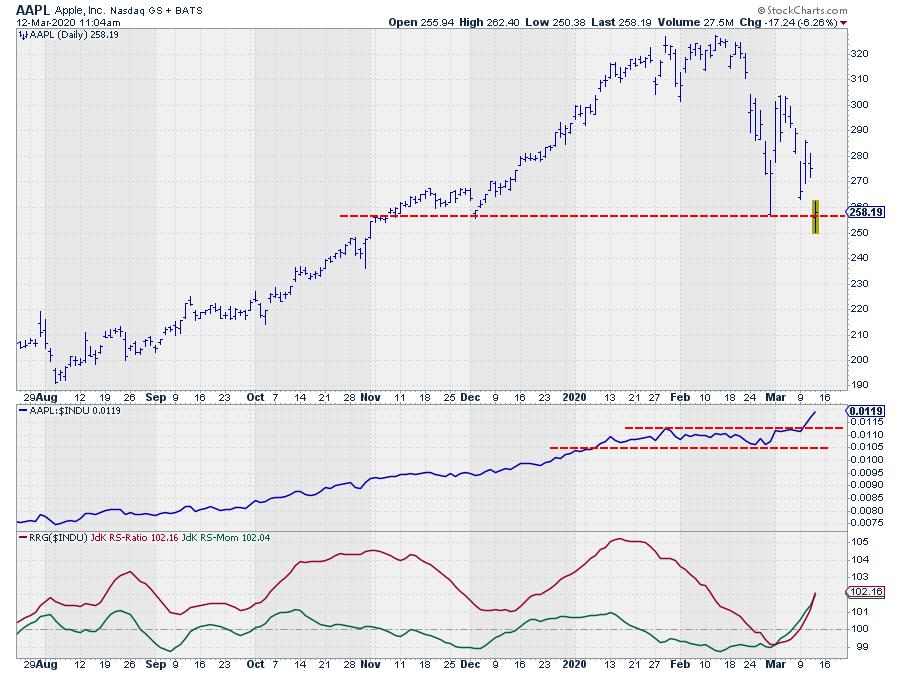
AAPL is testing support around $255 and seems to be bouncing off that level so far today. If we can hold that support level, AAPL will continue to look good from a relative perspective.
The RS-Line has just broken to new highs while the RRG-Lines are now both above 100 and rising.
On a side note, AAPL just triggered a Turtle Soup buy setup when it broke below its previous 20-bar low at $256.37 (2/28) this morning, then rallied back above that level. The TS setup triggered a long position on the break back above $256.37, with a stop at today's low of $250.38. Remember, this is a very short-term trade setup, but it certainly supports the AAPL:IBM pair trade idea.

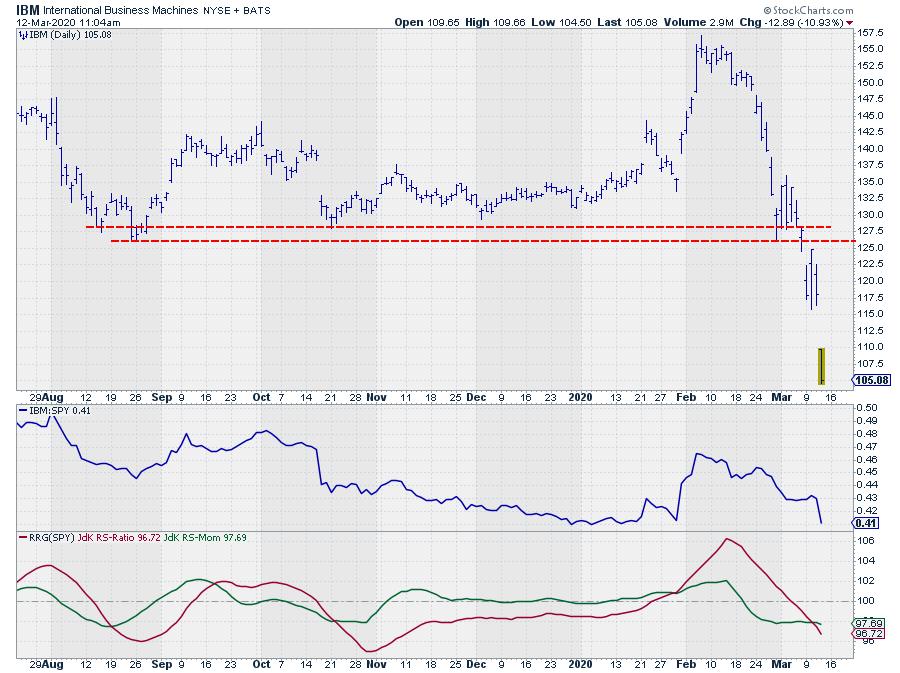
The IBM chart looks very different. The important horizontal support level between $125-$127.50 was convincingly broken a few days back and it will be a major resistance level when(ever) IBM is able to get back up. The first level to watch on the upside is the gap from $115 down. $100 is a major support level to watch... if that breaks, the downside will be wide open.
-- Julius
My regular blog is the RRG Charts blog. If you would like to receive a notification when a new article is published there, simply "Subscribe" with your email address.
Julius de Kempenaer
Senior Technical Analyst, StockCharts.com
Creator, Relative Rotation Graphs
Founder, RRG Research
Want to stay up to date with the latest market insights from Julius?
– Follow @RRGResearch on Twitter
– Like RRG Research on Facebook
– Follow RRG Research on LinkedIn
– Subscribe to the RRG Charts blog on StockCharts
Feedback, comments or questions are welcome at Juliusdk@stockcharts.com. I cannot promise to respond to each and every message, but I will certainly read them and, where reasonably possible, use the feedback and comments or answer questions.
To discuss RRG with me on S.C.A.N., tag me using the handle Julius_RRG.
RRG, Relative Rotation Graphs, JdK RS-Ratio, and JdK RS-Momentum are registered trademarks of RRG Research.
Julius de Kempenaer
Senior Technical Analyst, StockCharts.com
Creator, Relative Rotation Graphs
Founder, RRG Research
Host of: Sector Spotlight
Please find my handles for social media channels under the Bio below.
Feedback, comments or questions are welcome at Juliusdk@stockcharts.com. I cannot promise to respond to each and every message, but I will certainly read them and, where reasonably possible, use the feedback and comments or answer questions.
To discuss RRG with me on S.C.A.N., tag me using the handle Julius_RRG.
RRG, Relative Rotation Graphs, JdK RS-Ratio, and JdK RS-Momentum are registered trademarks of RRG Research.
