In a recent article in the RRG Blog titled "Is XLC taking over from XLK?", I identified the Communication Services sector as one of the potential new leading sectors in coming weeks. Currently, on the Relative Rotation Graph for US sectors, XLC is inside the improving quadrant, but is starting to rotate towards leading while not too far away from the 100-level on the JdK RS-Ratio axis.
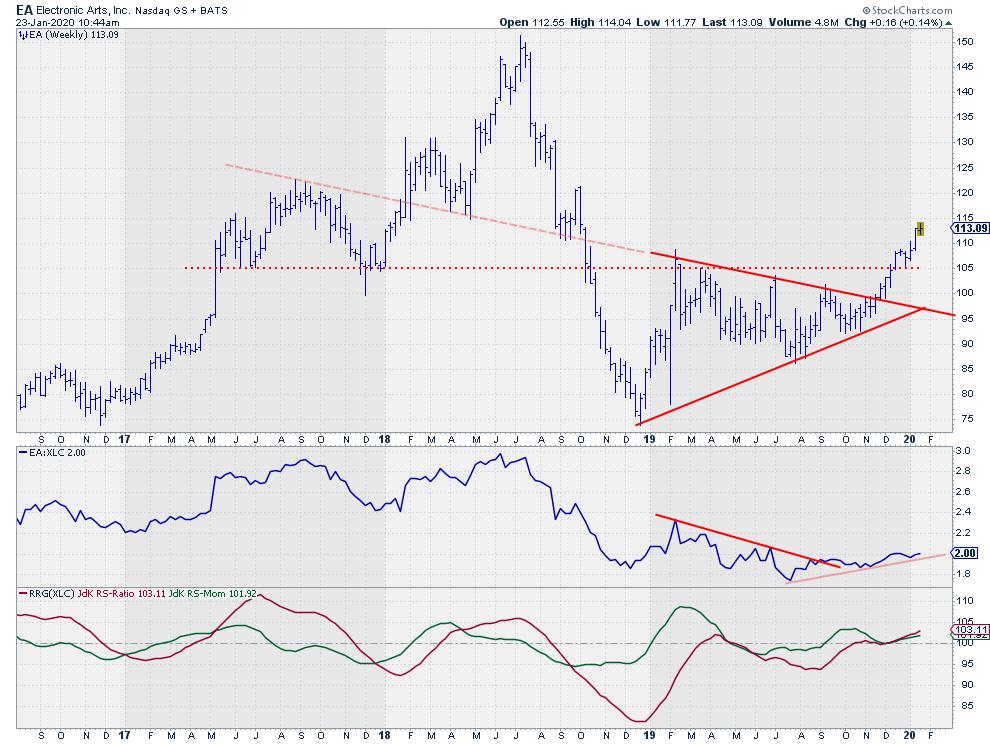
For this post, I drilled down into the individual XLC sector members and found EA at a very promising tail on both the weekly and the daily RRG, while the price chart holds enough characteristics to be judged as strong.
It's also a good example that stocks that are not trading at all-time-high levels can have good upside potential.
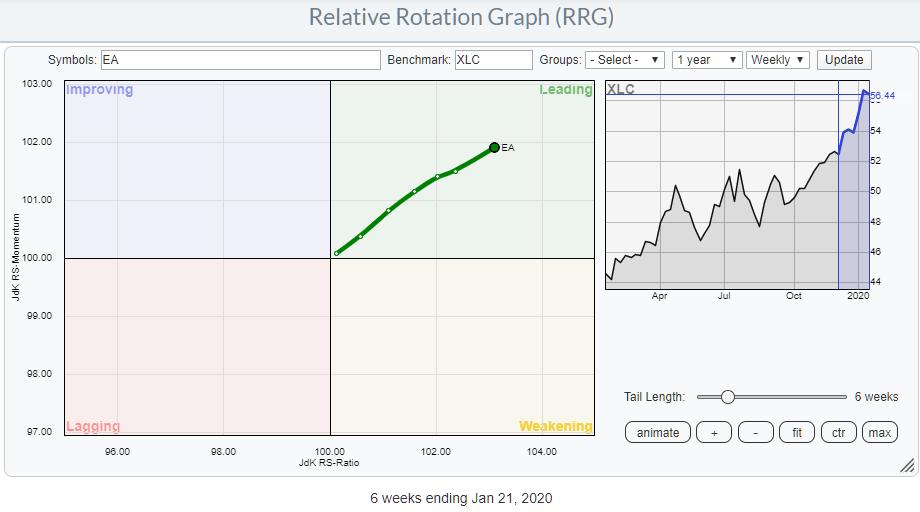
 Weekly RRG showing EA vs. XLC
The weekly RRG shows EA well inside the leading quadrant and traveling at an almost-perfect 45 degree angle, which means that the stock is gaining on both scales and thus in an uptrend against its sector benchmark (XLC).
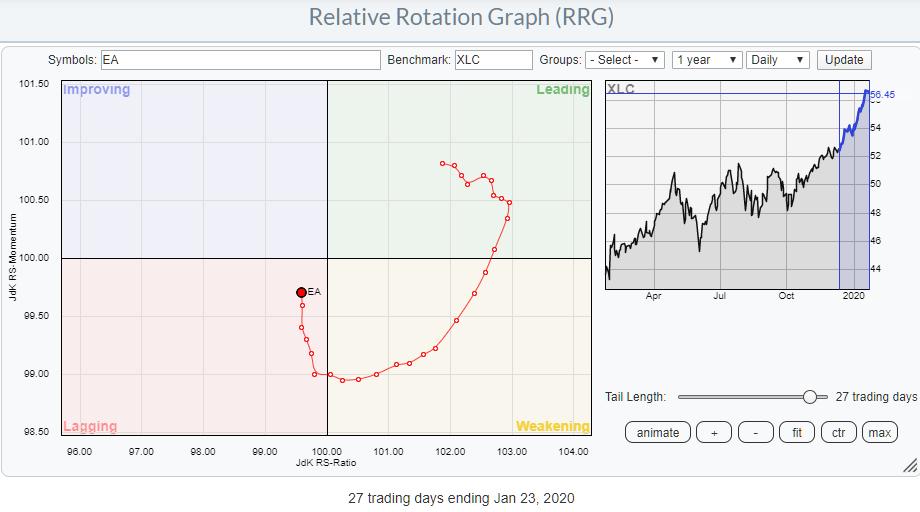
 Daily RRG showing EA vs. XLC
The daily RRG shows EA inside the lagging quadrant after rotating from leading through weakening, but, almost immediately after entering the lagging quadrant, JdK RS-Momentum started to improve, keeping EA very close to 100 on the RS-Ratio scale. A further improvement will push EA back into the leading quadrant on the daily RRG chart as well, bringing weekly and daily rotations back in sync and strengthening the positive outlook. The price chart at the top of this article holds enough positive signs for a further rise in coming weeks.
After a steep decline in 2018, EA formed a very large symmetrical triangle-like formation during 2019 and broke out of that pattern in Q4. The rally after that upward break is still ongoing and has already taken out important overhead resistance around $105; it seems ready to move even further.
The former resistance level near $105 can now be expected to start acting as support in case of a decline. New correction lows above that level look to be buying opportunities.
--Julius
My regular blog is the RRG Charts blog. If you would like to receive a notification when a new article is published there, simply "Subscribe" with your email address.
Julius de Kempenaer
Senior Technical Analyst, StockCharts.com
Creator, Relative Rotation Graphs
Founder, RRG Research
Want to stay up to date with the latest market insights from Julius?
– Follow @RRGResearch on Twitter
– Like RRG Research on Facebook
– Follow RRG Research on LinkedIn
– Subscribe to the RRG Charts blog on StockCharts
Feedback, comments or questions are welcome at Juliusdk@stockcharts.com. I cannot promise to respond to each and every message, but I will certainly read them and, where reasonably possible, use the feedback and comments or answer questions.
To discuss RRG with me on S.C.A.N., tag me using the handle Julius_RRG.
RRG, Relative Rotation Graphs, JdK RS-Ratio, and JdK RS-Momentum are registered trademarks of RRG Research.
Julius de Kempenaer
Senior Technical Analyst, StockCharts.com
Creator, Relative Rotation Graphs
Founder, RRG Research
Host of: Sector Spotlight
Please find my handles for social media channels under the Bio below.
Feedback, comments or questions are welcome at Juliusdk@stockcharts.com. I cannot promise to respond to each and every message, but I will certainly read them and, where reasonably possible, use the feedback and comments or answer questions.
To discuss RRG with me on S.C.A.N., tag me using the handle Julius_RRG.
RRG, Relative Rotation Graphs, JdK RS-Ratio, and JdK RS-Momentum are registered trademarks of RRG Research.
