The monthly charts for major markets like the S&P 500 Index are still in clear uptrends - that has not changed. But, in shorter timeframes, things have started to shift with regard to preference for asset classes.
In the first episode of my new StockCharts TV series Sector Spotlight, I went over these long-term trends using monthly charts, in case you'd like to review them.
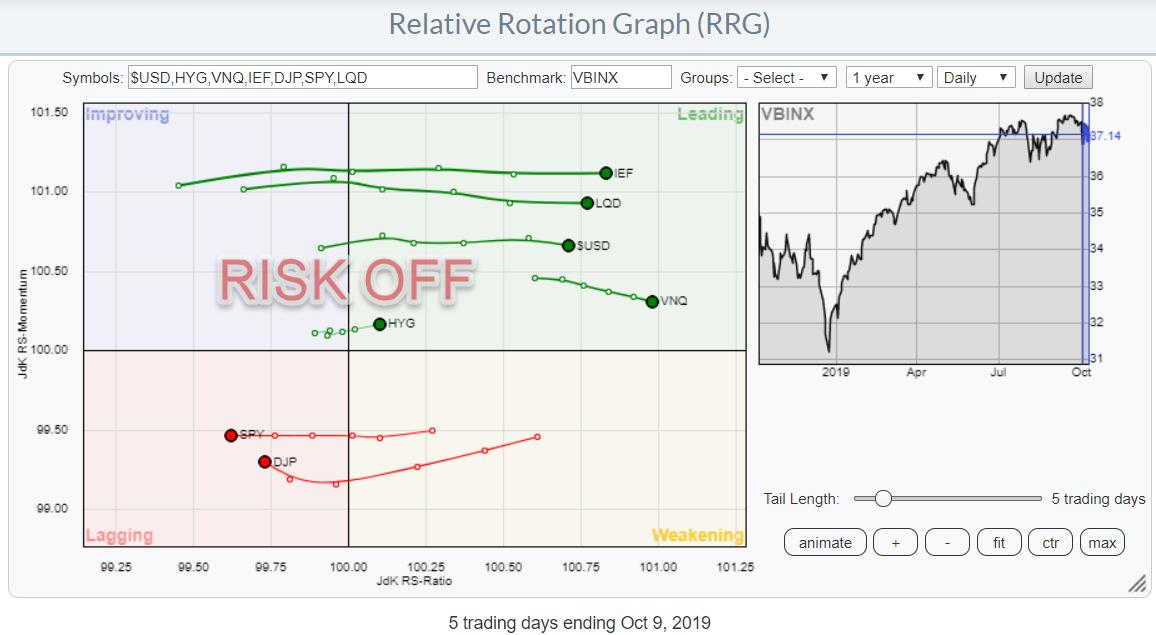
Within these long-term trends, we are now seeing a pretty clear shift taking place towards a more risk-off approach by the markets. The Relative Rotation Graph above shows the rotation of various asset classes using daily data; you can see that the tails are sending a clear message. All Fixed Income-related asset classes are in the top-right (leading) quadrant. Meanwhile, stocks and commodities, the riskier asset classes, are inside the bottom-left (lagging) quadrant.
What's even more important is the tail shown on those asset classes, which are almost horizontal. This means that the trends are moving further away from the benchmark, the center of the chart, at a stable momentum (rate of change). This suggests a continuation of the current rotational move.
Now there is a lot of volatility in the markets at the moment and we're being thrown up and down. Supply and demand is being driven by tweets and news. RRGs will provide you with the big picture to put all this in perspective.

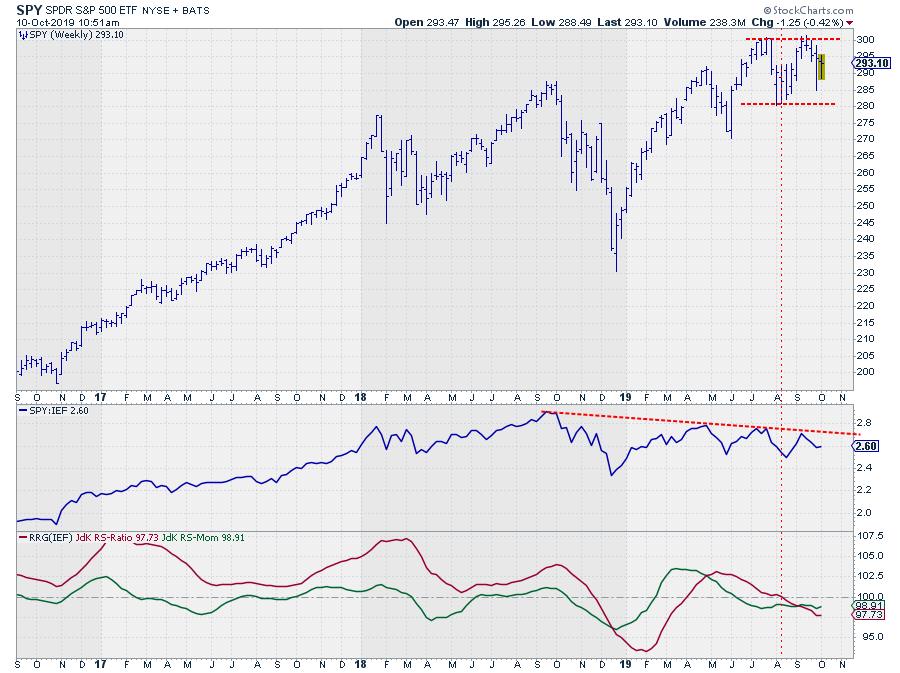
Finally, the chart of SPY, in combination with Relative Strength and the RRG-Lines, shows a series of declining peaks in relative strength since Q3 of last year and a crossover of the JdK RS-Ratio line below 100 in August of this year. Meanwhile, JdK RS-Momentum is stable at levels just below 100, which indicates a gradual decline.
All in all, the long-term trend for stocks is up, but the short-term charts are sending warning messages that should incentivize you to consider at least a temporary risk-off approach.
-Julius
My regular blog is the RRG Charts blog. If you would like to receive a notification when a new article is published there, simply "Subscribe" with your email address.
Julius de Kempenaer
Senior Technical Analyst, StockCharts.com
Creator, Relative Rotation Graphs
Founder, RRG Research
Want to stay up to date with the latest market insights from Julius?
– Follow @RRGResearch on Twitter
– Like RRG Research on Facebook
– Follow RRG Research on LinkedIn
– Subscribe to the RRG Charts blog on StockCharts
Feedback, comments or questions are welcome at Juliusdk@stockcharts.com. I cannot promise to respond to each and every message, but I will certainly read them and, where reasonably possible, use the feedback and comments or answer questions.
To discuss RRG with me on S.C.A.N., tag me using the handle Julius_RRG.
RRG, Relative Rotation Graphs, JdK RS-Ratio, and JdK RS-Momentum are registered trademarks of RRG Research.
Julius de Kempenaer
Senior Technical Analyst, StockCharts.com
Creator, Relative Rotation Graphs
Founder, RRG Research
Host of: Sector Spotlight
Please find my handles for social media channels under the Bio below.
Feedback, comments or questions are welcome at Juliusdk@stockcharts.com. I cannot promise to respond to each and every message, but I will certainly read them and, where reasonably possible, use the feedback and comments or answer questions.
To discuss RRG with me on S.C.A.N., tag me using the handle Julius_RRG.
RRG, Relative Rotation Graphs, JdK RS-Ratio, and JdK RS-Momentum are registered trademarks of RRG Research.
