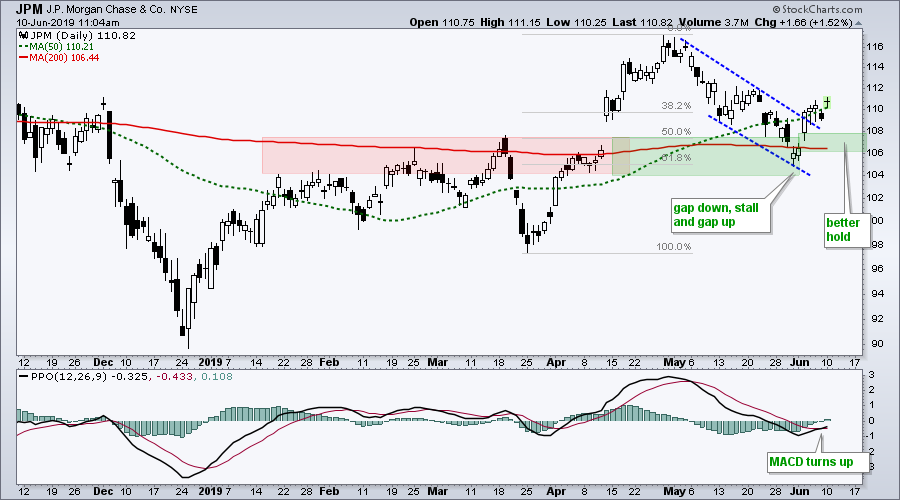
 Stocks moved sharply higher last week with several bouncing off broken resistance levels with gap reversals. JP Morgan is one such stock and last week's gap becomes the first area to watch going forward.
The chart shows JPM breaking out in mid April with a surge to the 116 area. The stock then fell back to the breakout zone around 106 and found support here. This is a classic tenet of technical analysis: broken resistance turns support. In addition, note that the May decline retraced 50-61.8% of the prior advance. Thus, it looks like two steps forward and one step backward (correction).
The stock reversed with a gap down, two day stall and gap up. An island reversal of sorts formed as the stock moved below its 200-day SMA and then back above this moving average. In addition, JPM broke out of a falling channel.
So far so good. The breakout is holding and the short-term trend reversal remains in play. The gap zone around 106-108 marks support going forward. A close below 106 would fill the gap and break support. This would negate last week's bullish developments.
Video: Improving Performance for the 200-day SMA
- SPY Gets Oversold Bounce
- Testing the 200-day SMA for $SPX
- Smoothing for Better Performance
- Applying SPX Signals to Other Indexes
- Testing Directional Changes in the 200-day
- Click here to Watch
Arthur Hill, CMT
Senior Technical Analyst, StockCharts.com
Author, Define the Trend and Trade the Trend
Want to stay up to date with the latest market insights from Arthur?
– Follow @ArthurHill on Twitter
– Subscribe to Art's Charts
– Watch On Trend on StockCharts TV (Tuesdays / Thursdays at 10:30am ET)

