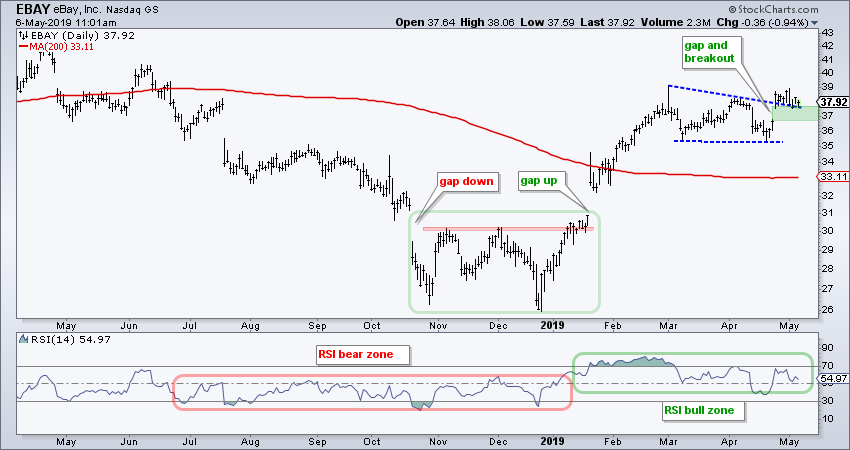
 Ebay (EBAY) reversed its downtrend with a reversal pattern and break above the 200-day SMA in late January and early February. After digesting its gains with a corrective pattern in March-April the stock broke out again with a gap and appears headed higher.
The stock formed a rare island reversal from October to January. Notice how the EBAY gapped below 31 and continued lower in October. After consolidating for a few months, the stock gapped above 31 in January and continued higher. The gaps align to create an island where those with short positions are trapped with losses.
After surging over 45% and comfortably clearing the 200-day, the stock corrected with a pennant of sorts. This sideways pennant represents a consolidation within an uptrend and a continuation higher is expected. The stock then broke out with a gap and surge above 37.
At this point, the pennant breakout and gap are holding, and bullish. The gap zone is the first area to watch for signs of a failed breakout. A close below 36.5 would fill the gap and negate the breakout. This would call for a re-evaluation of the bullish setup. Chartists looking for more confirmation after today's weakness can watch for a breakout at 38.5 to fill today's small gap down.
Interested in seasonality? Check out this weekend's ChartWatchers post: Improving the Best Six Months Strategy. There is also an accompanying video on our Youtube Channel.
Arthur Hill, CMT
Senior Technical Analyst, StockCharts.com
Author, Define the Trend and Trade the Trend
Want to stay up to date with the latest market insights from Arthur?
– Follow @ArthurHill on Twitter
– Subscribe to Art's Charts
– Watch On Trend on StockCharts TV (Tuesdays / Thursdays at 10:30am ET)

