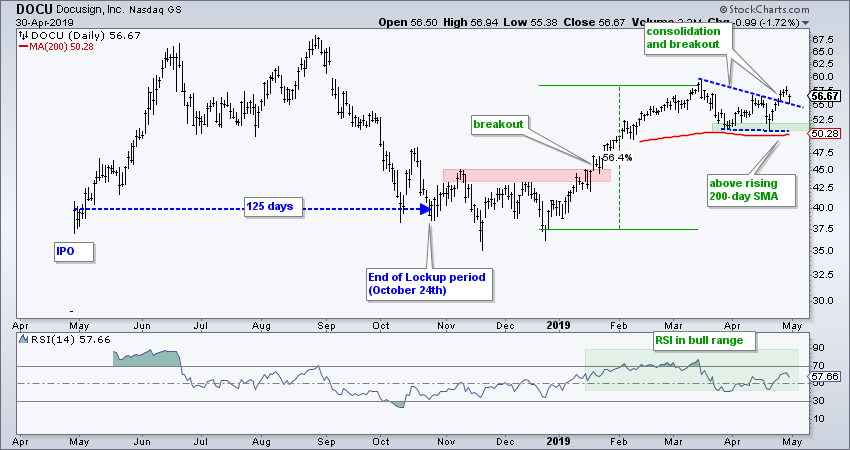
 Docusign (DOCU), a company that provides e-signature solutions, started trading on August 27th and surged over 30% on its IPO. The stock advanced another 65% after this initial gain and then fell back to the IPO price in October. Notice that the six month lockup period ended on October 24th and the stock established support in the 40 area the next two months. The stock moved higher in the first quarter and the chart looks bullish after a consolidation breakout in late April.
Even though there is less than a year of price history, there is enough to form an opinion on the short-term and long-term trends. DOCU broke out above a clear resistance zone in late January and advanced to the upper 50s. The stock is currently above its rising 200-day SMA and the long-term trend is up. Also note that RSI is trading in its bull range (40 to 80).
Turning short-term, the stock became extended after a 50+ percent advance and needed to work off this condition. DOCU traded flat for five weeks and formed a triangle. The consolidation after the advance did the trick and this triangle is a bullish continuation pattern. With a move above the mid April high, DOCU broke out and signaled a continuation of the prior advance. Chartists can mark support at the April lows and re-evaluate on a close below these lows.
On Trend on Youtube (Tuesday, 30-April)
- Three Big Sectors Lead New High List
- Yield Curve and Banks Turn Up
- Bond ETFs Test Breakout Zone
- Platinum Holds Breakout as Gold Corrects
- Stocks to Watch: PANW, PFPT, SCWX, EBAY
- Click here to Watch
Arthur Hill, CMT
Senior Technical Analyst, StockCharts.com
Author, Define the Trend and Trade the Trend
Want to stay up to date with the latest market insights from Arthur?
– Follow @ArthurHill on Twitter
– Subscribe to Art's Charts
– Watch On Trend on StockCharts TV (Tuesdays / Thursdays at 10:30am ET)

