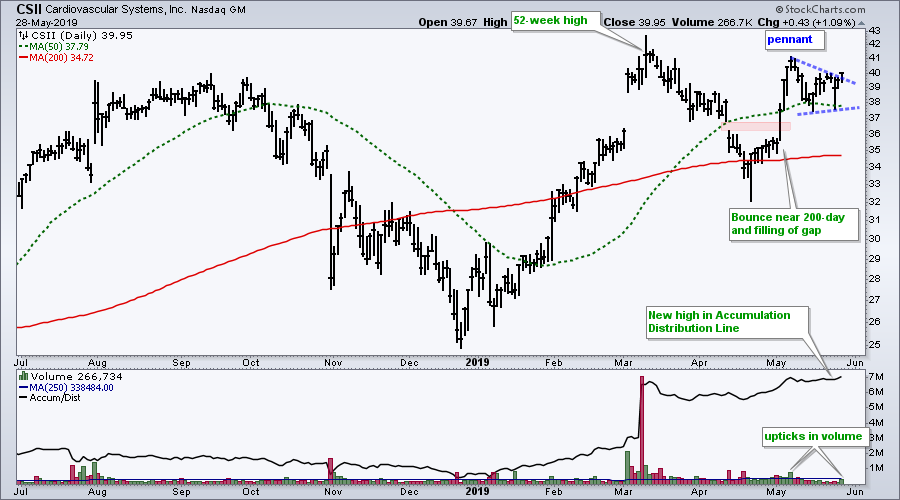
 Cardiovascular Systems (CSII) shows bullish price action with signs of accumulation that could lead to higher prices.
First and foremost, the long-term trend is up because CSII recorded a new high in early March and is above the 200-day SMA. The 50-day SMA (green) is also above the 200-day SMA (red).
After hitting a new high, the stock fell back to the 200-day SMA in April and even gapped lower on April 11th. This gap did not last long as the stock surged above 40 and filled the gap. This surge also put the stock back above its 50-day and 200-day lines.
A pennant formed after this surge and these are continuation patterns. This pennant is a bullish continuation pattern because the prior move was up. CSII held above the 50-day SMA as the pennant formed and broke the upper trend line on Tuesday. This is a bullish breakout and opens the door to new highs.
The indicator window shows volume and the Accumulation Distribution Line (ACDL), which hit a new high here in late May. This new high reflects strong accumulation in the stock and supports the bounce. Chartists can re-evaluate this bullish thesis on a close below 37.
On Trend on Youtube (Tuesday, 28-May)
- Walking Down the Lower Bollinger Band
- Sectors Above/Below 200-Day SMA
- Focus on XLV and Healthcare Stocks
- Breakdowns in Industrial and Discretionary Stocks
- FAAAM+: FB, AMZN, AAPL, GOOGL, MSFT (+NFLX).
- Click here to Watch
Arthur Hill, CMT
Senior Technical Analyst, StockCharts.com
Author, Define the Trend and Trade the Trend
Want to stay up to date with the latest market insights from Arthur?
– Follow @ArthurHill on Twitter
– Subscribe to Art's Charts
– Watch On Trend on StockCharts TV (Tuesdays / Thursdays at 10:30am ET)

