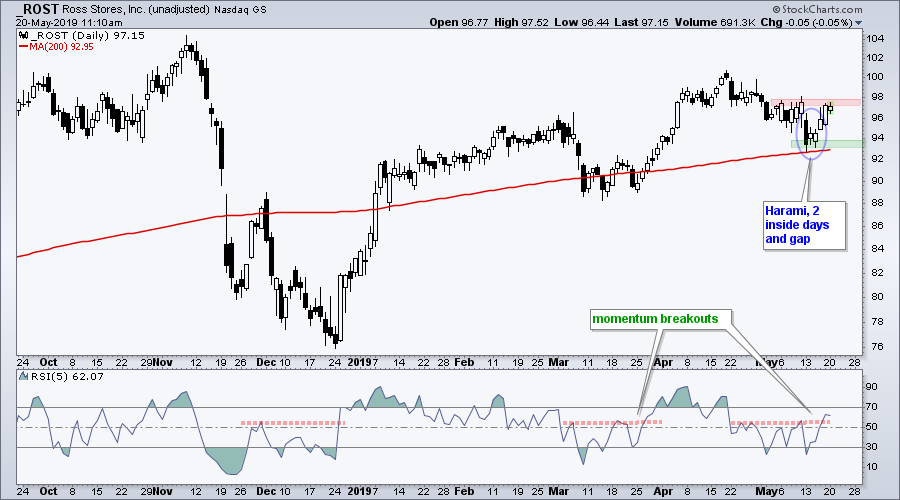
 Ross Stores (ROST) recently bounced off its rising 200-day SMA with a bullish candlestick pattern and short-term RSI broke to its highest level of the month. It looks like the short-term pullback is ending and the bigger uptrend is resuming.
ROST plunged in November-December with a sharp decline below the 200-day SMA. This plunged caused the 200-day to flatten in December, but it never really turned down. ROST quickly rebounded in January with a move back above the 200-day and the 200-day is back on the rise.
Short-term, the stock edged lower from late April to mid May with a decline back to the 200-day. A harami formed in mid May and there were also two inside days. These signaled indecision after a sharp decline as the stock suddenly firmed. ROST then gapped up and bounced the last three days. Last week's lows and the rising 200-day mark the first support level to watch for a failure.
The indicator window shows 5-day RSI for a short-term momentum perspective. RSI dipped below 30 twice in May and then broke above its prior highs last week. This represents a momentum breakout of sorts.
On Trend on Youtube (Thursday, 16-May)
- Oversold Bounces Underway (SPY and Sector SPDRs)
- Focus on SOXX and Semiconductor Stocks
- Treasury Yields Continue to Fall (TLT and IEF Rise)
- Stocks to Watch: FIVS, MSFT, TMUS, WDAY
- Click here to Watch
Arthur Hill, CMT
Senior Technical Analyst, StockCharts.com
Author, Define the Trend and Trade the Trend
Want to stay up to date with the latest market insights from Arthur?
– Follow @ArthurHill on Twitter
– Subscribe to Art's Charts
– Watch On Trend on StockCharts TV (Tuesdays / Thursdays at 10:30am ET)

