 An existing uptrend and short-term breakout on high volume point to higher prices for Boston Scientific.
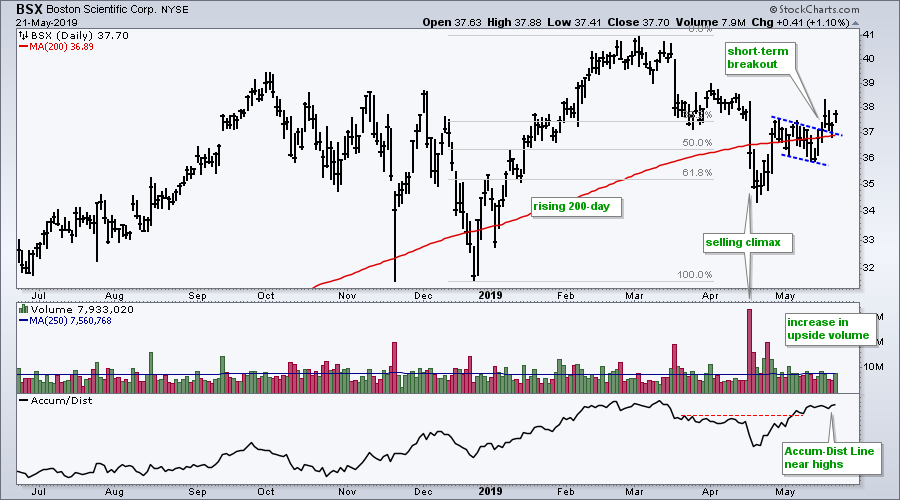
The chart below show BSX hitting a new high in early March and then falling rather sharply into mid April. A volume spike punctuates the plunge below 35 and this looks like a selling climax that washed out most the sellers. The stock then recovered with a move back above its rising 200-day SMA and I think the long-term uptrend remains intact.
Short-term, the stock moved above its 200-day in late April and then corrected into mid May with a falling flag pattern. This is a bullish continuation pattern that represents a small correction. BSX broke out of the flag pattern last week and this breakout is largely holding.
The lower windows show daily volume and the Accumulation Distribution Line. First, notice that upside volume has regularly outpaced downside volume since April 25th. Second, notice that the Accumulation Distribution Line is above its April highs and already back near its March high. This reflects a buyer recovery and shows accumulation since late April.
There are two levels to watch going forward. A move below the mid May low would negate the flag breakout and be short-term negative. Further weakness below the April low would signal a bigger breakout and be long-term negative.
On Trend on Youtube (Tuesday, 21-May)
- Correction/Consolidation Mode
- Breadth Weakens as Small-caps Lead Lower
- Mean-Reversion Bounce Update
- Check List for Trend and Leadership
- Stocks to Watch: FISV, BSX, LLY...
- Click here to Watch
Arthur Hill, CMT
Senior Technical Analyst, StockCharts.com
Author, Define the Trend and Trade the Trend
Want to stay up to date with the latest market insights from Arthur?
– Follow @ArthurHill on Twitter
– Subscribe to Art's Charts
– Watch On Trend on StockCharts TV (Tuesdays / Thursdays at 10:30am ET)

