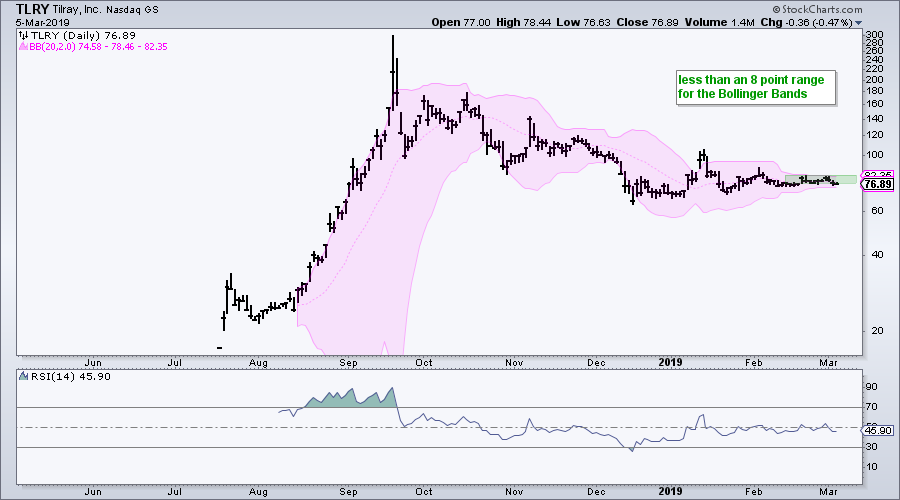
 Tilray (TLRY) listed on the Nasdaq at $17 with an IPO in July and promptly surged above $300. The stock then worked its way below 100 over the next few months and managed to stabilize in the 65 to 80 zone this year.
The chart below shows the Bollinger Bands contracting to their narrowest since the stock began trading. Thus, the squeeze in on as volatlity contracts. The distance between the upper band and lower band is less than 8 points and BandWidth is below 10%. BandWidth equals upper band less lower band divided by middle band.
The Bollinger Band squeeze alerts traders to be ready for a move, but it does not provide any directional clues. Chartists must simply wait for the break. A break above the upper band would be bullish, while a break below the lower band would be bearish.
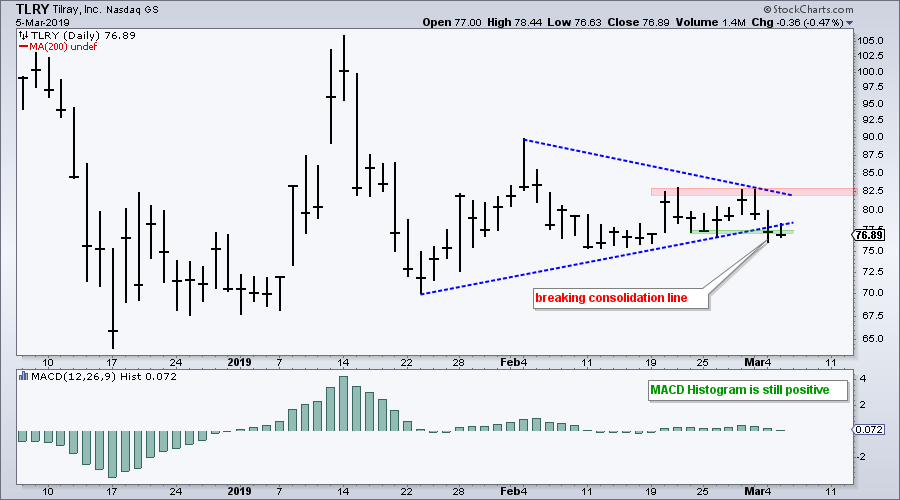
The next chart shows TLRY over the last three months and analysis points to a downside break. First, note that several cannabis stocks were higher over the last few days, but Tilray moved lower. Second, the stock fell sharply in the second half of January and then consolidated with a triangle. Tilray broke below the triangle line on Monday and this signals a continuation lower.
Keep in mind that Cannabis stocks are quite volatile and Tilray is one of the most volatile. Anything could happen. The triangle highs mark resistance and a break above 83 would call for a reassessment of this bearish analysis.
On Trend on YouTube
SPY Stalls as Small-caps Edge Lower
- Small-Caps Lead Pullback.
- High Flyers Take a Breather.
- QQQ Heavyweights Come to Life.
- HealthCare Providers weigh on XLV.
- Banks, Bollinger Bands and Bandwidth.
- Stocks to Watch: MLM, VMC, IRM, GLUU.
- Click here to Watch
- Arthur Hill, CMT
Senior Technical Analyst, StockCharts.com
Book: Define the Trend and Trade the Trend
Twitter: Follow @ArthurHill


