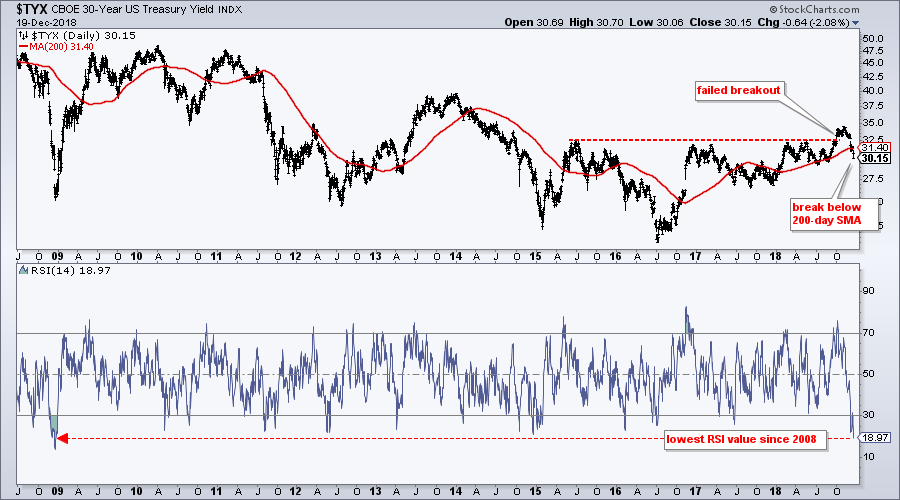
 It was not long ago that the 30-yr T-Yield ($TYX) was breaking above a three year resistance line and the outlook for yields was bullish (bearish for bonds). Admittedly, I was in that camp. The tables have turned as the 30-yr Yield failed to hold the breakout and sliced below its 200-day moving average.
The chart below shows the yield breaking resistance at 32.5 (3.25%) in September. The breakout held for two months and then crumbled in December as the yield fell back towards 3% (30 on chart). The yield broke through the 200-day SMA in convincing fashion and the trend is now down.
The indicator window shows 14-day RSI moving below 20 and to its lowest level since 2008. RSI was overbought and above 70 around 10 weeks ago. The plunge in RSI shows strong momentum in the downside move. Even though RSI is very oversold, such strong momentum could be indicative of a long-term trend change in the 30-yr yield. Thus, the expectations heading into 2019 are for falling Treasury yields and rising bond prices.
On Trend on Youtube
Topics for Tuesday, December 18th:
- Global Asset Overview with 7 PerfChart Groups
- New High to New Low in a Short Period
- Expansion of New Lows from October to December
- Underperformers Throughout 2018
- Three Themes Affecting the Financial Markets
- Click here to Watch
- Arthur Hill, CMT
Senior Technical Analyst, StockCharts.com
Book: Define the Trend and Trade the Trend
Twitter: Follow @ArthurHill

