Viacom (VIAB) is part of the broadcasting-entertainment industry group, which is part of the Communication Services SPDR (XLC). The stock acted more like a defensive share in the first half of the year by underperforming from January to May. VIAB bottomed in June and outperformed the broader market over the last five months.
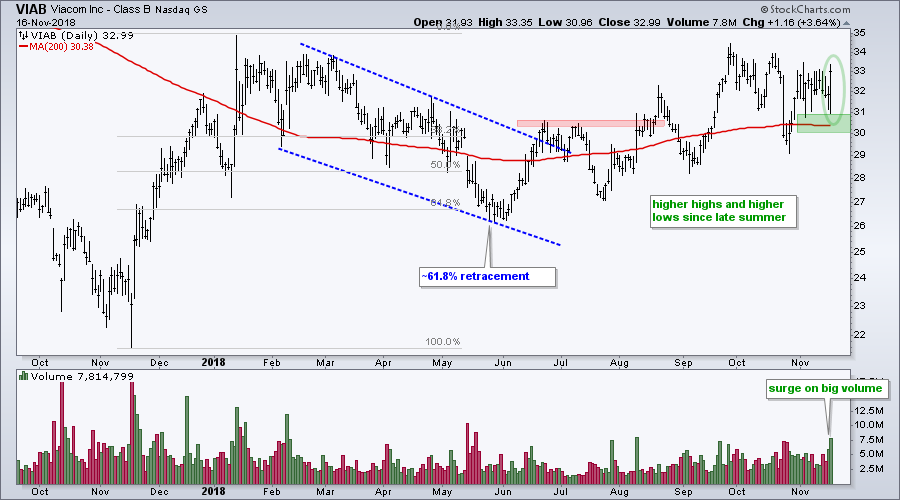
On the price chart below, we can see VIA correcting after a big surge from November to January. The correction formed a falling channel/wedge as the stock retraced 61.8% of the prior gain. A 1/2 to 2/3 retracement is fairly normal for a correction within a bigger uptrend.
The correction ended with a higher low in July and breakout in late August. The stock forged another higher high in late September, and then fell back to the 200-day SMA. The stock still has a progression of higher lows in place and the trend is up.
VIA caught my eye because it surged with big volume on Friday. This move reinforces support in the 30-31 area and argues for a continuation of the existing uptrend. Failure to hold the 200-day and a close below 30 would call for a reassessment.
Plan Your Trade and Trade Your Plan.
- Arthur Hill, CMT
Senior Technical Analyst, StockCharts.com
Book: Define the Trend and Trade the Trend
Twitter: Follow @ArthurHill

