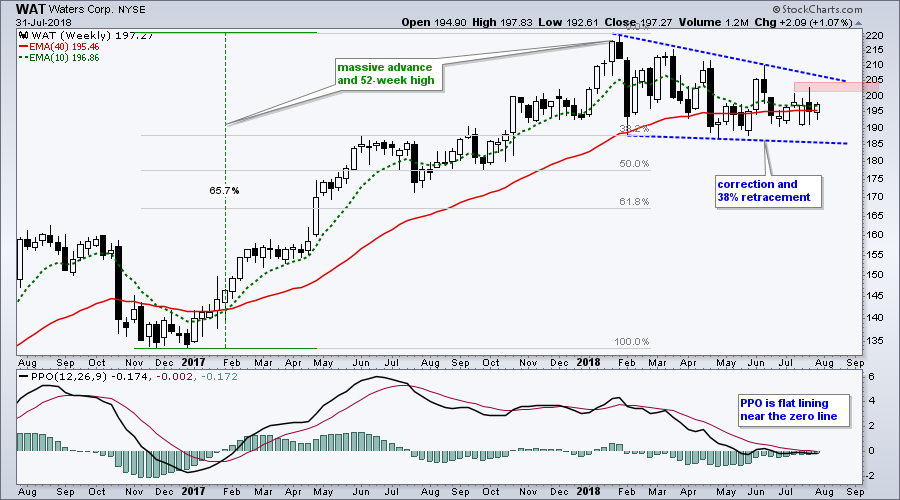
 Waters Corp led the market in 2017 with a 65 percent gain, but lagged in 2018 as the stock corrected the last six months. I am watching this correction pattern for a breakout that would signal a continuation of the bigger uptrend. Waters Corp makes analytical equipment and software for laboratories and scientists.
How long and how far should a correction extend? When does a correction turn into a something more, such as a bigger downtrend? Those are, of course, the million-dollar questions when analyzing a chart. A lot depends on your timeframe so keep in mind that this is a weekly chart covering two years, which I would consider a long-term timeframe. Ideally, a correction should retrace 1/3 to 2/3 of the prior advance and key moving average crosses should hold. In Fibonacci terms, a correction should retrace 38.2 to 61.8 percent.
The chart below shows WAT retracing around 38.2% of the prior advance with a falling wedge over the last six months. This is still a normal amount for a correction within a bigger uptrend and the 10-week EMA remains above the 40-week EMA (barely).
The stock is finding support in the 190-195 area and the range narrowed over the last six weeks. As with a Bollinger Band squeeze, this narrowing range signals indecision that could foreshadow a decisive move. But which way? Here are two things to watch. A weekly close above 205 would break the six week range and argue for further strength. Chartists can also watch the PPO for an upturn and move back into positive territory.
On Trend on Youtube
Available to everyone On Trend with Arthur Hill airs Tuesdays at 10:30AM ET on StockCharts TV and repeats throughout the week at the same time. Each show is then archived on our Youtube channel.
Topics for Tuesday, July 30th:
- Customizing CandleGlance Lists.
- Revisiting XLF and the Big Banks.
- XLV and Big Pharma Lead.
- Performance Disparities within SOXX..
- Stocks to Watch: ALL, AGN, DG, KSS, WMT.
- Click here to Watch
Plan Your Trade and Trade Your Plan.
- Arthur Hill, CMT
Senior Technical Analyst, StockCharts.com
Book: Define the Trend and Trade the Trend
Twitter: Follow @ArthurHill

