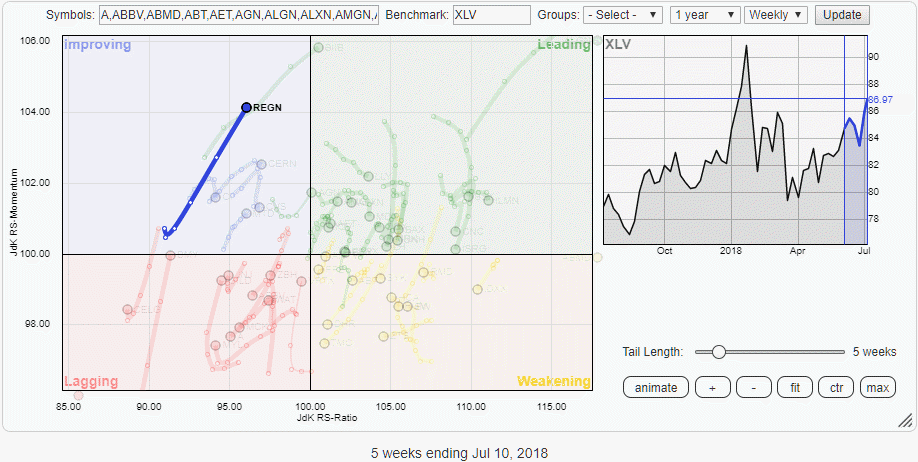
 On the Relative Rotation Graph that shows all members of the Health Care sector (XLV) against the XLV benchmark, REGN stands out in a positive way.
On the weekly RRG, the stock is positioned inside the improving quadrant, close to leading and moving at a strong RRG-Heading while the week-to-week distances on the tail are increasing.
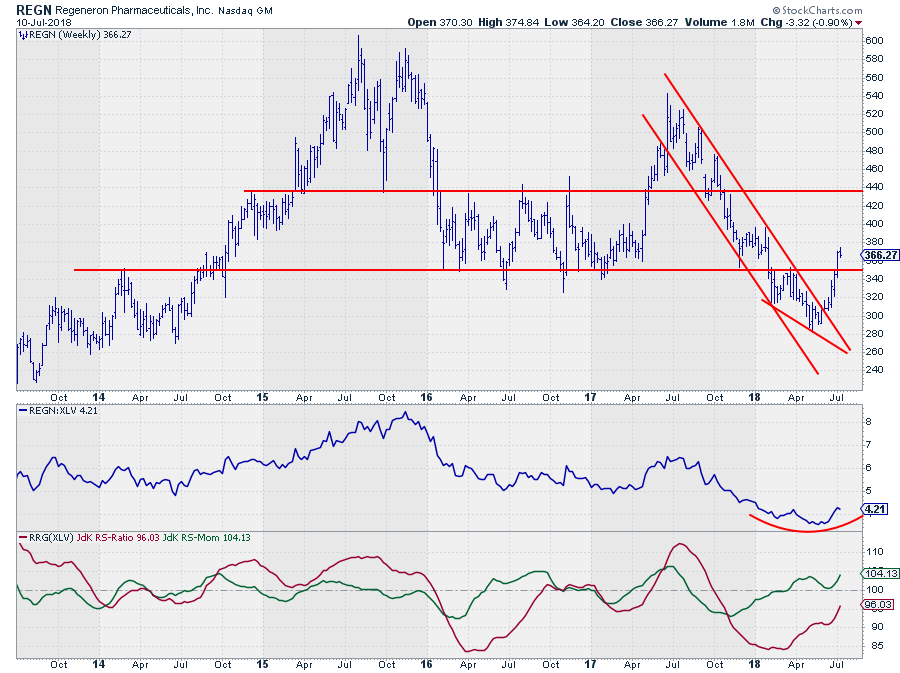
When we bring REGN back to a regular chart there are a few technical observations to be made.
In the first place the downtrend that was in play since mid-2017 was broken when price moved above the falling resistance line. Formally it is not yet in an uptrend as since the break price moved higher in an almost straight line so there is no first higher low that we use as an anchor to identify a new series of higher highs and higher lows. At least not on the weekly time-frame. On the daily chart, a series of higher highs and higher lows was started mid-June.
Secondly, the major support level around $ 350 which was tested either as support or as resistance over the past five years, was recently broken in upward direction again. This brings the next major target near $ 440 in sight with intermediate resistance to be expected around $ 400, the early 2018 peak. The downside is well protected by the horizontal level around $ 350 which can now be expected to act as support again.
From a relative perspective, things are turning around for this stock as well. The JdK RS-Momentum line moved above 100 a few months ago, indicating strength and the JdK RS-Ratio is now rapidly catching up.
With both the price- and the relative trend turning around, REGN is a chart that is better not ignored.
Let me know what you think of this usage of RRG in the comments? If you want to receive a notification when a new article in the RRG blog is published? Simply "Subscribe" and leave your E-mail address.
Julius de Kempenaer | RRG Research
RRG, Relative Rotation Graphs, JdK RS-Ratio, and JdK RS-Momentum are registered TradeMarks ®; of RRG Research
Follow RRG Research on social media:
If you want to discuss RRG with me on SCAN, please use my handle Julius_RRG so that I will get a notification.

