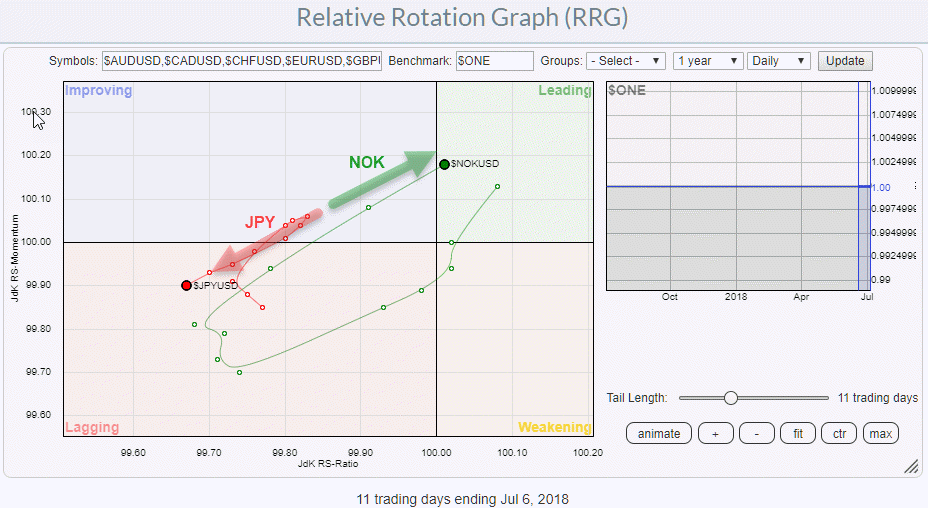
 Relative Rotation Graphs are not only used to look at sector-rotation or help with asset allocation decisions but can also help you to pinpoint potential forex trades.
Most currency traders are short-term orientated so the RRG above is a daily chart showing the rotation of the Norwegian Krone and the Japanese Yen vs the US dollar.
You can easily re-create this chart by selecting the pre-defined group "G10-FX USD base" from the drop-down box on the RRG page and set the interval to daily. The chart will show all G10 currencies related to the USD. Ie, 9 currencies on the RRG and USD as the benchmark in the center.
In the RRG above I have only selected $NOKUSD and $JPYUSD to display to get a clearer picture of the rotations I want to focus on.
Tails at opposite RRG-heading
As you can see these two tails rotate in opposite directions, almost directly opposite.
Three to five days ago the Norwegian krone turned into a 0-90 degree heading and the day-to-day distance on the tail started to increase. The Japanese Yen, a day or so earlier, turned into a 180-270 degree heading after a brief trip through improving and jumped back into lagging while also showing increased day-to-day distances on the tail.
This rotation indicates strength for NOK and weakness for JPY.
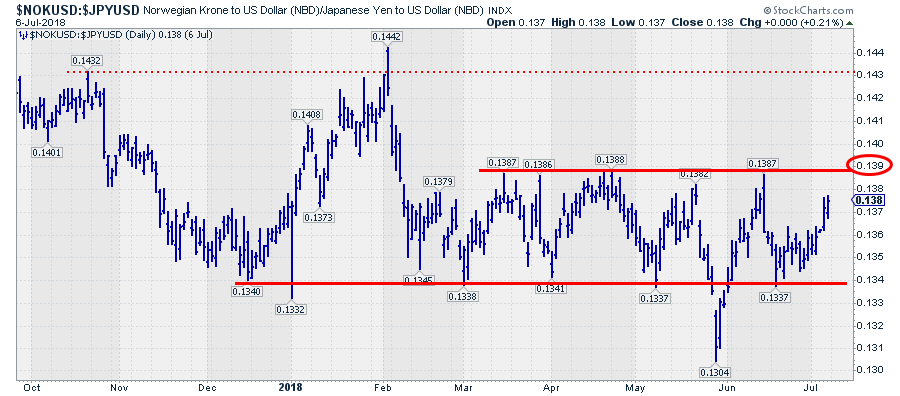
The $NOKJPY is not a very commonly traded pair which means that not too many people are looking at it. As a matter of fact, $NOKJPY is not available on the system as a symbol as such. But... we can create that relationship by entering $NOKUSD:$JPYUSD on a SharpChart.
This will give you the picture below.
 The trading range between 0.134 and 0.139 since March is clearly visible and also the wider range between 0.134 and 0.143 if we go back to 2017 and early 2018 highs, shows up.
The (false) break that occurred late May serves as a good example of a break that reverses back into a range subsequently pushes back to the opposite side of that range, in this case, a test of the upper boundary around 0.139. It is also a good example of why using stops in currency trading makes sense.
After the recent test of the lower boundary NOKJPY is now traveling back towards the 0.139 area.
I am watching this NOKJPY cross for a break above that resistance level and then accelerate towards the next resistance level near 0.143. Stops then just below the breakout level.
Let me know what you think of this usage of RRG in the comments? If you want to receive a notification when a new article in the RRG blog is published? Simply "Subscribe" and leave your E-mail address.
Julius de Kempenaer | RRG Research
RRG, Relative Rotation Graphs, JdK RS-Ratio, and JdK RS-Momentum are registered TradeMarks ®; of RRG Research
Follow RRG Research on social media:
If you want to discuss RRG with me on SCAN, please use my handle Julius_RRG so that I will get a notification.
