Rockwell Automation reversed its downtrend with a big surge in May, worked off overbought conditions and looks poised to resume its uptrend.
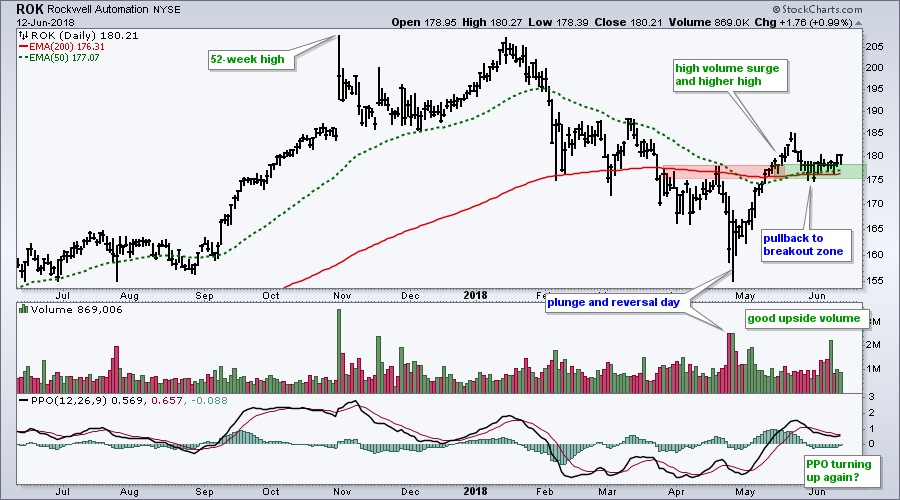
The chart below shows ROK with a high-volume plunge in late April, a high-volume reversal day and a sharp recovery in early May. This recovery extended with high volume as the stock broke above the April high. The strength of this advance leads me to believe that it reversed the downtrend from January to April.
Rockwell was quite overbought in late May and worked off this overbought condition with a pullback to the breakout zone (175-178). Notice how the broken resistance zone turned into a support zone as the stock firmed for two weeks. Signs of an upturn are emerging as the stock moved higher the last four days.
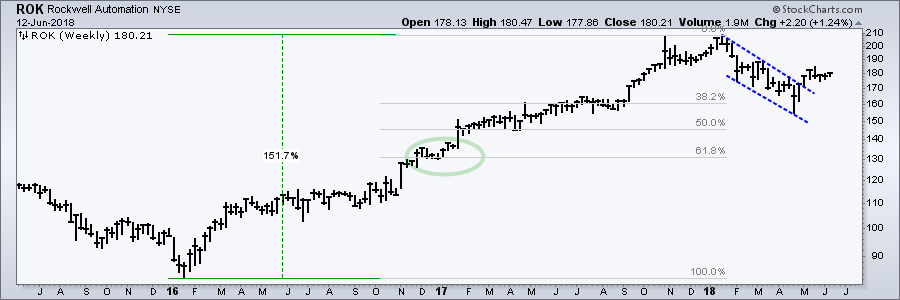
Even though the chart above covers a full year, it does not put this decline into perspective. The next chart shows weekly bars over the last three years. Note that ROK advanced some 150% from January 2016 to January 2018. This year's decline retraced 38.2-50% and formed a falling wedge. Yep, the retracement amount and pattern are typical for corrections within a bigger uptrend. ROK broke out of the wedge in May and it looks like the bigger uptrend is resuming.
On Trend on Youtube
Available to everyone On Trend with Arthur Hill airs Tuesdays at 10:30AM ET on StockCharts TV and repeats throughout the week at the same time. Each show is then archived on our Youtube channel.
Topics for Tuesday, June 12th:
- Airlines Have yet to Take Off (Raff Channel Tutorial).
- Mean-Reversion Setup for Oil ($WTIC, USO).
- XES Hits Moment-of-truth as XLE Holds Gap (plus AMLP, CVX, SLB).
- XLF and Big Banks Remain Weaklings (C, BAC, GS, MS, USB).
- Treasury Bonds Firm as Fed Meeting Looms.
- Stocks to Watch: HON, UTX, CSCO, GPN, MSI, PFPT, SNPS, RSG, AET, MDT.
- Click Here to Watch
- Arthur Hill, CMT
Senior Technical Analyst, StockCharts.com
Book: Define the Trend and Trade the Trend
Twitter: Follow @ArthurHill


