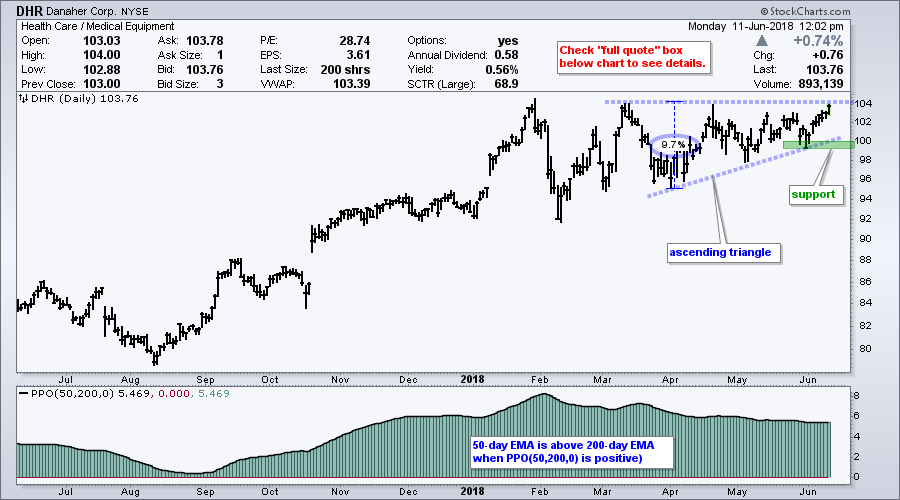
 Danaher (DHR) is a conglomerate that is the 15th largest component (1.91%) of the Health Care SPDR (XLV) and the 5th largest component (5.43%) of the Medical Devices ETF (IHI). XLV broke out last week and IHI has been leading for some time. The stock is also looking strong as an ascending triangle takes shape.
The chart shows Danaher with the Percentage Price Oscillator (50,200,0) in the indicator window. This indicator measures the percentage difference between the 50-day EMA and 200-day EMA. I use it to define the long-term trend and my trading bias. The PPO has been positive for over a year and the long-term trend is up.
An ascending triangle is a bullish continuation pattern that forms within an uptrend. I took the conservative approach and drew the pattern from March to June, but it could also be possible to draw from January to June. The rising lows show demand coming in at higher prices and the equal highs represent overhead supply.
A breakout at 104 would confirm the pattern and target a move to the 114 area. The height of the pattern measures 9.7% and we can add this to the breakout zone. Thus, a 9.7% advance from 104 would target a move to 114.09 (give or take a dime). Take these targets with a grain of salt.
The late May low marks support and chartists can use to level for a re-evaluation. A close below this low would negate the pattern and call for a re-assessment of the bullish case.
On Trend Youtube Channel
Be sure to catch On Trend with Arthur Hill on StockCharts TV. Available to everyone, this show airs every Tuesday at 10:30 AM and is then archived on our Youtube Channel.
- Arthur Hill, CMT
Senior Technical Analyst, StockCharts.com
Book: Define the Trend and Trade the Trend
Twitter: Follow @ArthurHill

