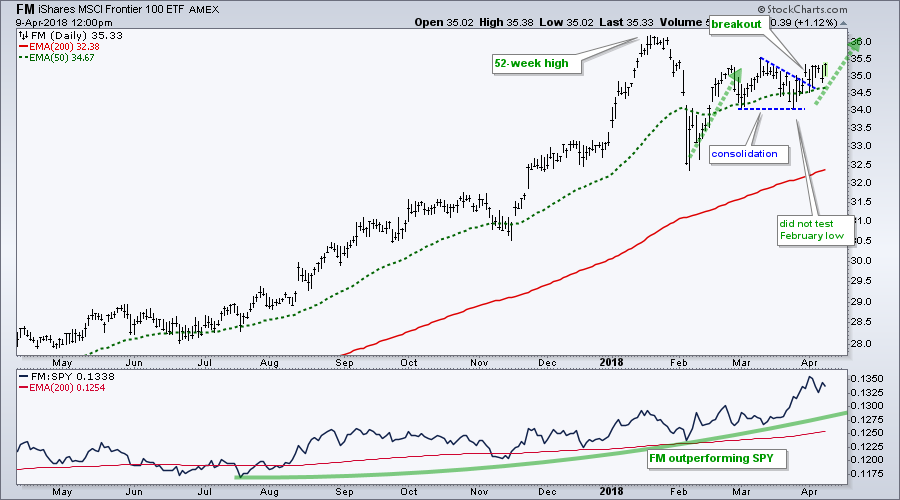
 The Frontier Markets ETF (FM) has been outperforming the S&P 500 SPDR (SPY) since summer and held up much better than the US market in March-April. FM recently broke out of a consolidation and it looks like the bigger uptrend is continuing.
The chart below shows FM with the 50-day EMA and 200-day EMA. The ETF is above both EMAs, the 50-day EMA is above the 200-day EMA and it recorded a 52-week high in January. It is safe to say that the long-term trend is up.
The ETF surged in February, consolidated in March and then broke out of its consolidation last week. This breakout signals a continuation of the February surge and I would expect FM to exceed its January high. Chartists can use the March lows to mark support at 34.
The indicator window shows the FM:SPY ratio turning up in July and moving to new highs over the last few months. This price relative hit a new high in early April and this means FM is outperforming SPY.
Chartists interested in this ETF can learn more at the iShares website. Argentina (21.64%), Vietnam (18.23%), Kuwait (16.11%), Morocco (7.05%) and Kenya (6.84%) are the top holdings.
https://www.ishares.com/us/products/239649/ishares-msci-frontier-100-etf
Programming Note: My debut on StockCharts TV kicks off this Tuesday at 10:30AM. We will start by testing some key moving averages for the S&P 500.
Plan Your Trade and Trade Your Plan.
- Arthur Hill, CMT
Senior Technical Analyst, StockCharts.com
Book: Define the Trend and Trade the Trend
Twitter: Follow @ArthurHill


