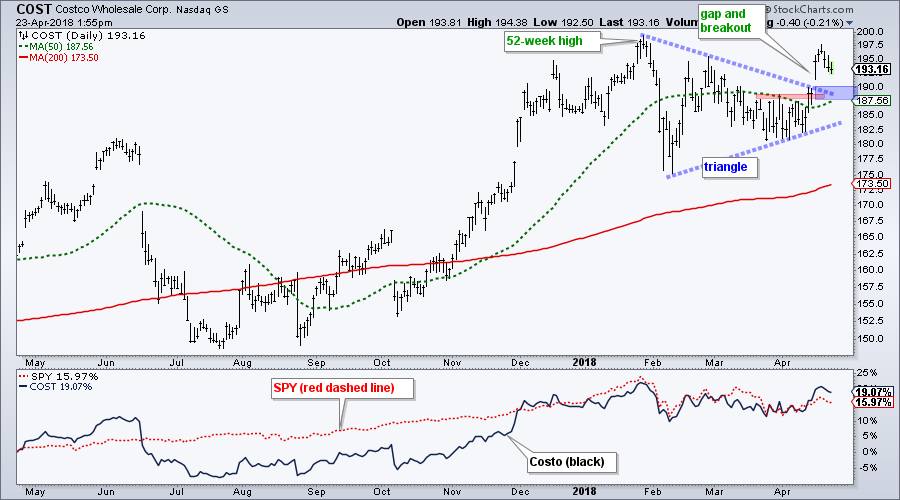
 Costco (COST) is showing some upside leadership this year with a triangle breakout and challenge to the January high.
Long-term trend identification is important because it sets my bias going forward. My bias is bullish when the long-term trend is up and this means I favor bullish patterns over bearish patterns. The overall trend is clearly up because Costco hit a 52-week high earlier this year, the 50-day moving average is above the 200-day and price is above the 200-day.
COST stalled after hitting the new high and formed a big triangle from late January to early April. A consolidation within an uptrend is typically a bullish continuation pattern. The breakout signals an end to this consolidation period and a resumption of the bigger uptrend.
The breakout zone in the 188-190 area turns into the first support zone to watch on a throwback (blue shading). A throwback occurs when prices return to the scene of the breakout. Broken resistance is expected to turn support and this is an area to watch for a bounce.
The indicator window shows the performance lines for SPY (red-dashed) and COST (black). Both are up double digits over the past year, but COST has a slight edge with a 19% gain. SPY is up a respectable 16% since late April 2016.
Plan Your Trade and Trade Your Plan.
- Arthur Hill, CMT
Senior Technical Analyst, StockCharts.com
Book: Define the Trend and Trade the Trend
Twitter: Follow @ArthurHill

