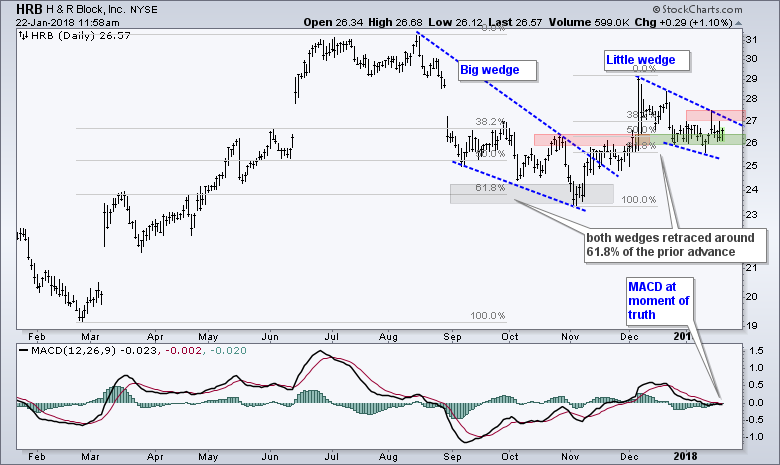
The chart for H&R Block (HRB) shows two corrective patterns, one confirmed and one working. First, HRB retraced around 61.8% of the February-August advance and formed A big wedge. The wedge pattern and the retracement amount are typical for corrections after a sharp advance. HRB broke out with a surge above 27 in early December and this indicates that the bigger trend is up.
A smaller wedge formed over the last few weeks as the stock again retraced around 61.8% of the prior advance. Also notice that broken resistance turns into support in the 26 area. The stock firmed the last few weeks and I am watching for a breakout at 27.5. Such a move would reverse the recent slide and signal a continuation of the bigger wedge breakout.
The indicator window shows MACD flattening around the zero line. MACD is at its moment-of-truth and an upturn from here would be bullish.
Plan Your Trade and Trade Your Plan.
- Arthur Hill, CMT
Senior Technical Analyst, StockCharts.com
Book: Define the Trend and Trade the Trend
Twitter: Follow @ArthurHill

