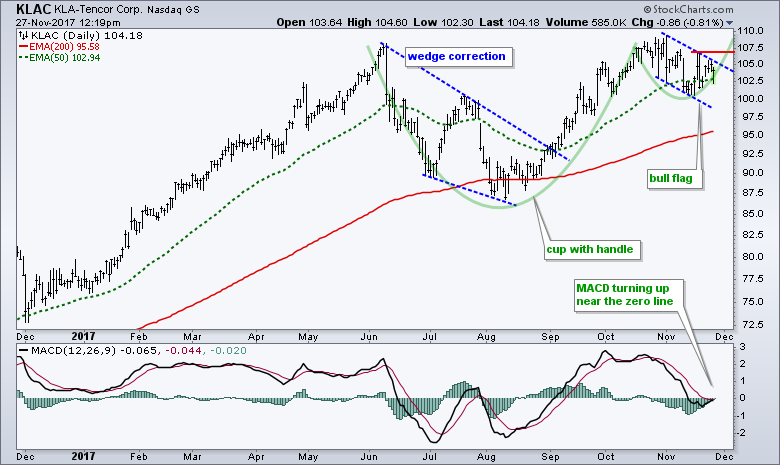
KLA-Tencor (KLAC), a semiconductor equipment and materials designer and manufacturer, is in a long-term uptrend with large and small bullish continuation patterns working. The chart shows 52-week highs in May and October so the long-term trend is clearly up. The green outline highlights a cup-with-handle forming from June to November. On the right side of this pattern, we can see a sharp advance from August to October and then a pullback in November (blue lines). This pullback looks like a falling flag, which is also a bullish continuation pattern. A break above the mid November high would end the flag and signal a continuation of the August-October advance. A break above the prior highs would confirm the cup-with-handle and be even more bullish. Also notice that the indicator window shows MACD turning up near the zero line.
****************************************
Thanks for tuning in and have a great day!
--Arthur Hill CMT
Plan your Trade and Trade your Plan
*****************************************

