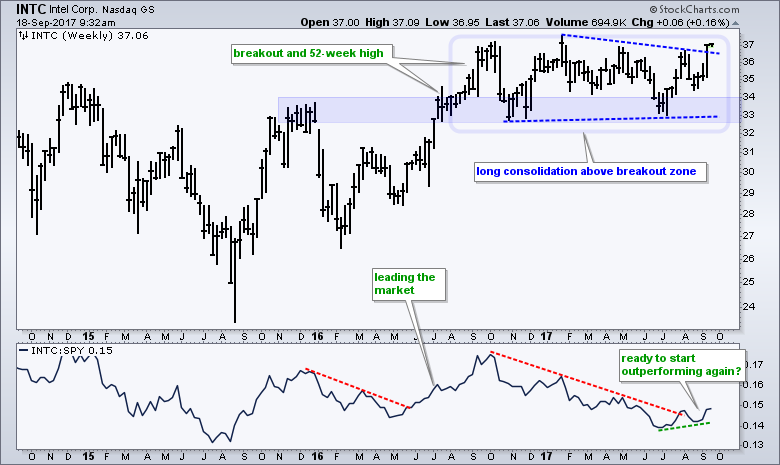
Some sixty stocks in the S&P 500 were up 5% or more last week, and Intel was one of them. Intel's importance seems to have diminished over the years, but it is still an industry gorilla that accounts for around 11% of the Semiconductor ETF (SMH) and 8% of the Semiconductor iShares (SOXX). The chart shows Intel breaking out to new highs and leading the market for a few months in 2016. The stock then moved into a long consolidation and traded flat the last 12 months. On the bullish side, notice that the breakout zone turned into a support zone and Intel consolidated above the breakout (blue zone). In addition, a consolidation after an advance is typically a bullish continuation pattern. Thus, a breakout would signal a continuation of the 2016 advance We are already seeing signs of strength with a break above the triangle line and an upturn in the price relative (INTC:SPY ratio).
Follow me on Twitter @arthurhill - Keep up with my 140 character commentaries.
****************************************
Thanks for tuning in and have a good day!
--Arthur Hill CMT
Plan your Trade and Trade your Plan
*****************************************

