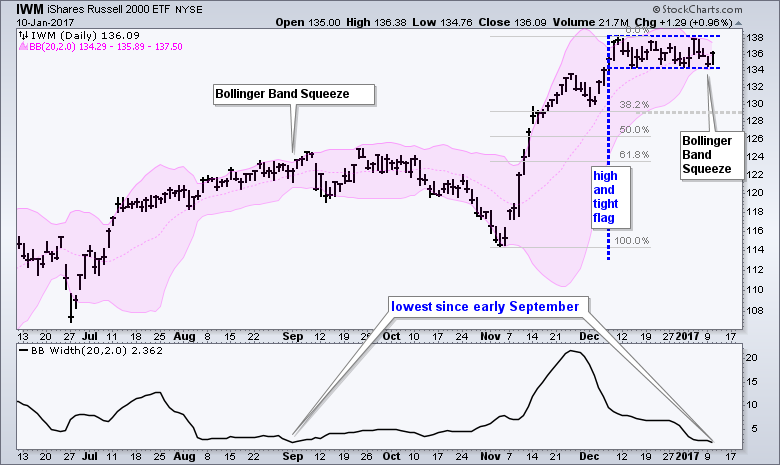
After a big surge from early November to early December, the Russell 2000 iShares (IWM) moved into a tight trading range the last four weeks. Chartists should watch the resolution of this trading range for the next directional clue. The chart shows Bollinger Bands confirming a volatility contraction as the bands narrowed significantly. We can measure the distance between the bands using the BandWidth indicator, which is shown in the indicator window. Notice that BandWidth dipped to its lowest level since early September.
John Bollinger theorized that volatility expansions follow volatility contractions and this means we should expect a significant move - sooner rather than later. But which way? Classical chartists will no doubt view this flat consolidation as a high and tight flag, which is a bullish continuation pattern. An upside breakout would be bullish and signal a continuation of the prior advance. Also note that the big trend is clearly up and this favors further upside. A break below consolidation support would be short-term negative, but not enough to affect the bigger uptrend. In other words, a minor support break could simply lead to a retracement of the prior advance. The Fibonacci Retracements Tool marks the first retracement (38.2%) in the 129 area.
****************************************
Thanks for tuning in and have a great day!
--Arthur Hill CMT
Plan your Trade and Trade your Plan
*****************************************

