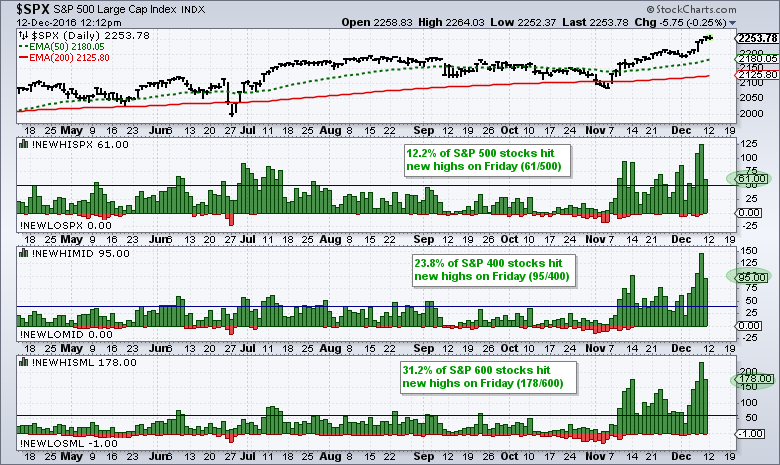
As a percentage of total issues, small-caps are churning out more new highs than large-caps and leading the market. The chart below shows new highs (green) and new lows (red) for the S&P 500, S&P MidCap 400 and S&P Small-Cap 600 over the last eight months. Notice that there were 61 new highs in the S&P 500 on Friday, 95 new highs in the S&P MidCap 400 and 178 new highs in the S&P Small-Cap 600. As a percentage of the total issues, small-caps are leading the charge because over 30% of stocks in the index hit new highs. Also notice that new highs exceeded 100 twice for the S&P 500 and S&P MidCap 400 last week. New highs exceeded 150 on Wednesday, Thursday and Friday for the S&P Small-Cap 600, and even surpassed 200 last Thursday. There is clearly broad strength within the small-cap universe and this is where the leaders are to be found.
****************************************
Thanks for tuning in and have a great day!
--Arthur Hill CMT
Plan your Trade and Trade your Plan
*****************************************

